
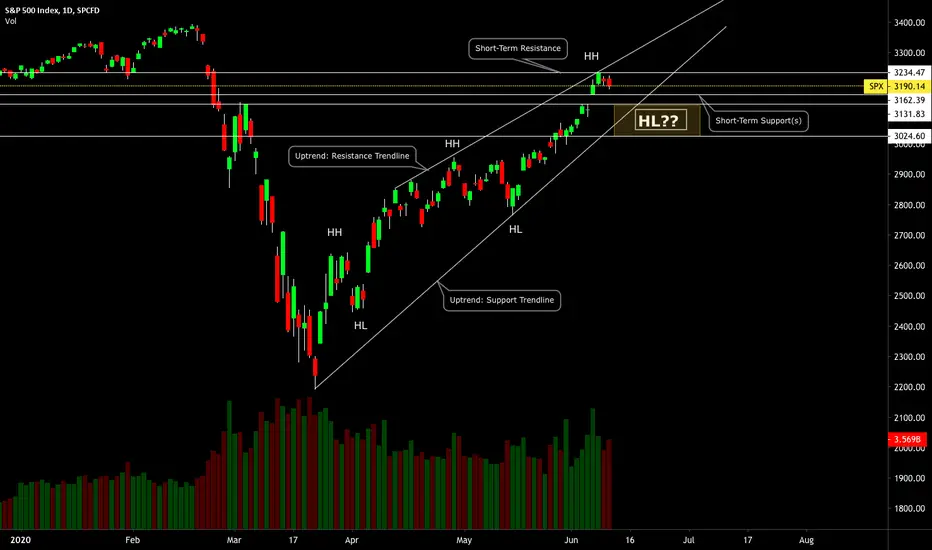
The SPX (S&P 500 index) has been in a uptrend, making a series of higher-highs and higher-lows in price.
A potential pullback play is forming, and the price could fall to the horizontal support levels or support trendline.
Support levels: 3162.39 and 3131.83 and 3024.60.
Resistance levels: 3234.47 and 3263.00 and 3328.58.
__________________________________________________________________________________________________
Thanks for checking out this chart idea. Click Like, Follow, and always remember: NO FOMO.
A potential pullback play is forming, and the price could fall to the horizontal support levels or support trendline.
Support levels: 3162.39 and 3131.83 and 3024.60.
Resistance levels: 3234.47 and 3263.00 and 3328.58.
__________________________________________________________________________________________________
Thanks for checking out this chart idea. Click Like, Follow, and always remember: NO FOMO.
ノート
06/11/2020: First set of Support targets reached.Second set of Support Targets for SPX: 2964.60 and 2844.50 and 2777.81.
トレード終了: 利益確定目標に到達
SPX: Target Completed.
Follow Me on TradingView and Youtube.
Social Media links are in my profile.
Boost, comment, share to support.
All posts are not financial advice.
Social Media links are in my profile.
Boost, comment, share to support.
All posts are not financial advice.
免責事項
これらの情報および投稿は、TradingViewが提供または承認する金融、投資、取引、またはその他の種類の助言もしくは推奨であることを意図したものではなく、またこれらに該当するものでもありません。詳細は利用規約をご覧ください。
Follow Me on TradingView and Youtube.
Social Media links are in my profile.
Boost, comment, share to support.
All posts are not financial advice.
Social Media links are in my profile.
Boost, comment, share to support.
All posts are not financial advice.
免責事項
これらの情報および投稿は、TradingViewが提供または承認する金融、投資、取引、またはその他の種類の助言もしくは推奨であることを意図したものではなく、またこれらに該当するものでもありません。詳細は利用規約をご覧ください。