
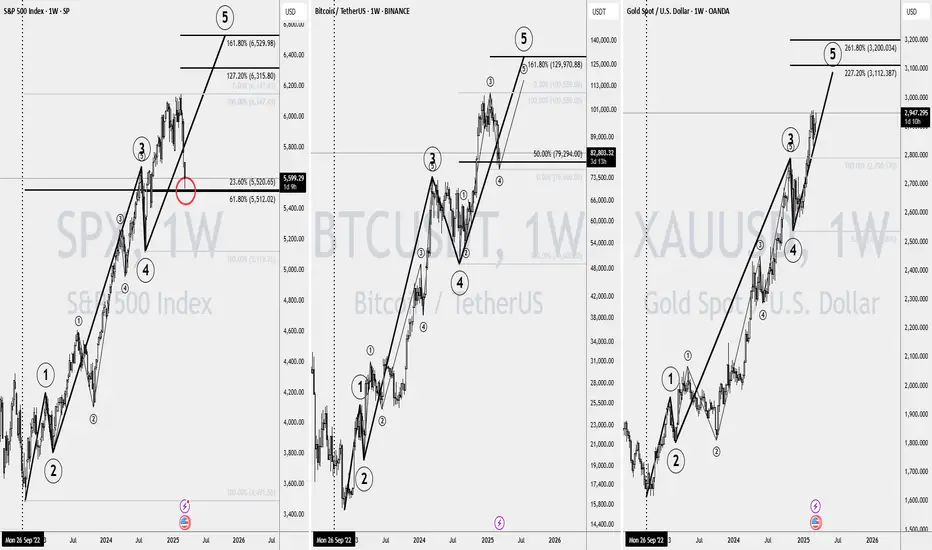
Today, I’m analyzing the weekly charts of the S&P 500 Index, Gold, and Bitcoin. Notice anything interesting? 🤔
Since late 2022, these assets have been moving in sync, showing an unusually strong correlation. At times, it almost feels like they’re behaving as a single market. But spotting these connections provides valuable insights we can use to our advantage.
One chart that stands out is the S&P 500 Index, particularly its rebound from the dual Fibonacci support zone around $5520. This is a critical level, and as long as it holds, both Bitcoin and Gold are likely to maintain their upward momentum.
For now, the overall market sentiment remains bullish, and this trend could continue throughout the year. 🚀
Since late 2022, these assets have been moving in sync, showing an unusually strong correlation. At times, it almost feels like they’re behaving as a single market. But spotting these connections provides valuable insights we can use to our advantage.
One chart that stands out is the S&P 500 Index, particularly its rebound from the dual Fibonacci support zone around $5520. This is a critical level, and as long as it holds, both Bitcoin and Gold are likely to maintain their upward momentum.
For now, the overall market sentiment remains bullish, and this trend could continue throughout the year. 🚀

免責事項
これらの情報および投稿は、TradingViewが提供または承認する金融、投資、取引、またはその他の種類の助言もしくは推奨であることを意図したものではなく、またこれらに該当するものでもありません。詳細は利用規約をご覧ください。
免責事項
これらの情報および投稿は、TradingViewが提供または承認する金融、投資、取引、またはその他の種類の助言もしくは推奨であることを意図したものではなく、またこれらに該当するものでもありません。詳細は利用規約をご覧ください。