
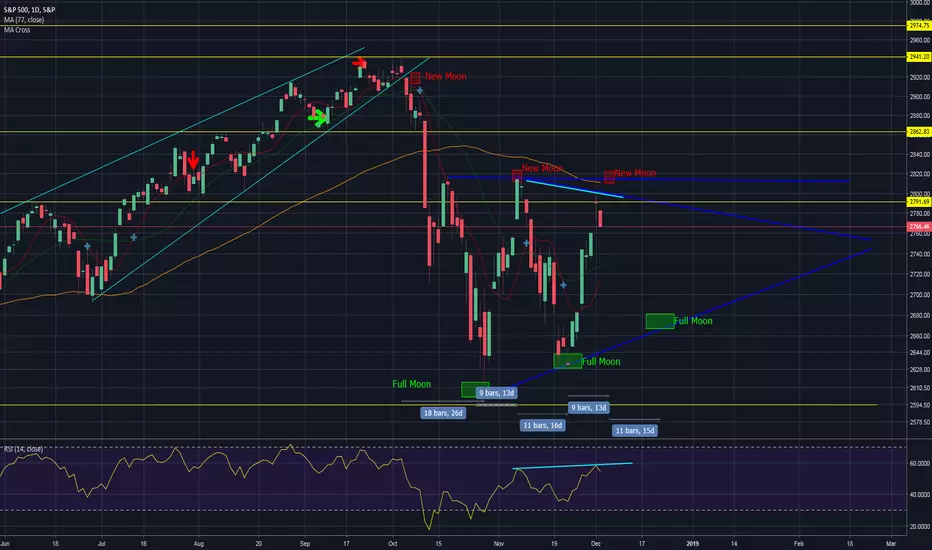
We can see here how the highs and lows form, and how they coincide with the phases of the moon. Something to keep in mind when making your trading decisions.
Bearish Divergence forming on Daily candle chart. Possible bear flag
Not investment advice. Theoretical ideas, only.
Bearish Divergence forming on Daily candle chart. Possible bear flag
Not investment advice. Theoretical ideas, only.

免責事項
これらの情報および投稿は、TradingViewが提供または承認する金融、投資、取引、またはその他の種類の助言もしくは推奨であることを意図したものではなく、またこれらに該当するものでもありません。詳細は利用規約をご覧ください。
免責事項
これらの情報および投稿は、TradingViewが提供または承認する金融、投資、取引、またはその他の種類の助言もしくは推奨であることを意図したものではなく、またこれらに該当するものでもありません。詳細は利用規約をご覧ください。