At times like this, technicians may over analyze to explain and predict where we're going with the markets.
But sometimes the answer is in the most basic and fundamental technical patterns/signals.
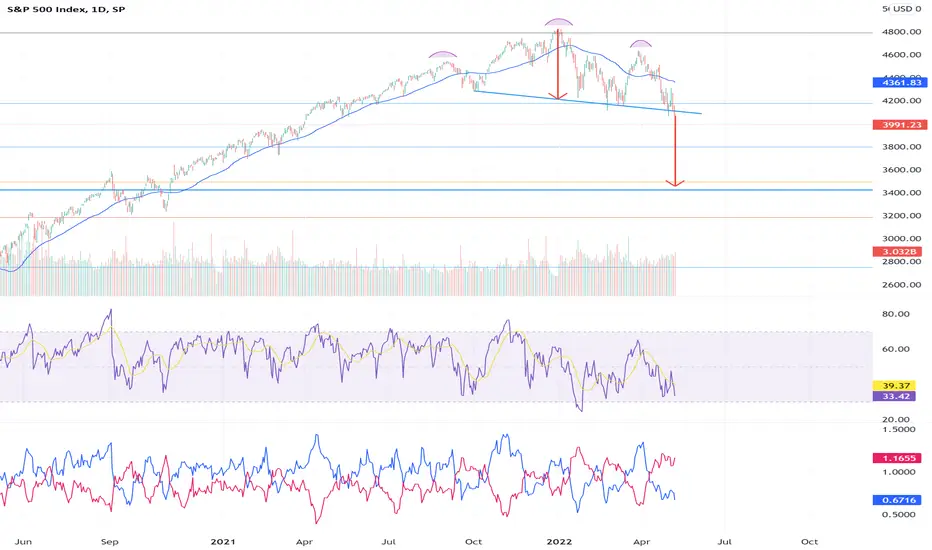
 SPX has been showing a Head and Shoulders patterns since about a year back, and in the last session broke through the neckline of the H&S.
The target to the downside can be estimated by measuring the top to the neckline then applying the same distance from the breakpoint.
That puts us at around the 3400 level, which is also near a fib support level.
RSI also has bit more to go before being oversold. Speed and pace of decline to this point is unknown.
SPX probably won't go straight down, but may test the neckline support level and retrace to test resistence here.
My general feeling is that those are opportunities to sell/short short term rallies.
Good luck everyone.
But sometimes the answer is in the most basic and fundamental technical patterns/signals.
SPX has been showing a Head and Shoulders patterns since about a year back, and in the last session broke through the neckline of the H&S.The target to the downside can be estimated by measuring the top to the neckline then applying the same distance from the breakpoint.
That puts us at around the 3400 level, which is also near a fib support level.
RSI also has bit more to go before being oversold. Speed and pace of decline to this point is unknown.
SPX probably won't go straight down, but may test the neckline support level and retrace to test resistence here. My general feeling is that those are opportunities to sell/short short term rallies.
Good luck everyone.

免責事項
これらの情報および投稿は、TradingViewが提供または承認する金融、投資、取引、またはその他の種類の助言もしくは推奨であることを意図したものではなく、またこれらに該当するものでもありません。詳細は利用規約をご覧ください。
免責事項
これらの情報および投稿は、TradingViewが提供または承認する金融、投資、取引、またはその他の種類の助言もしくは推奨であることを意図したものではなく、またこれらに該当するものでもありません。詳細は利用規約をご覧ください。