
Technical Analysis and Outlook:
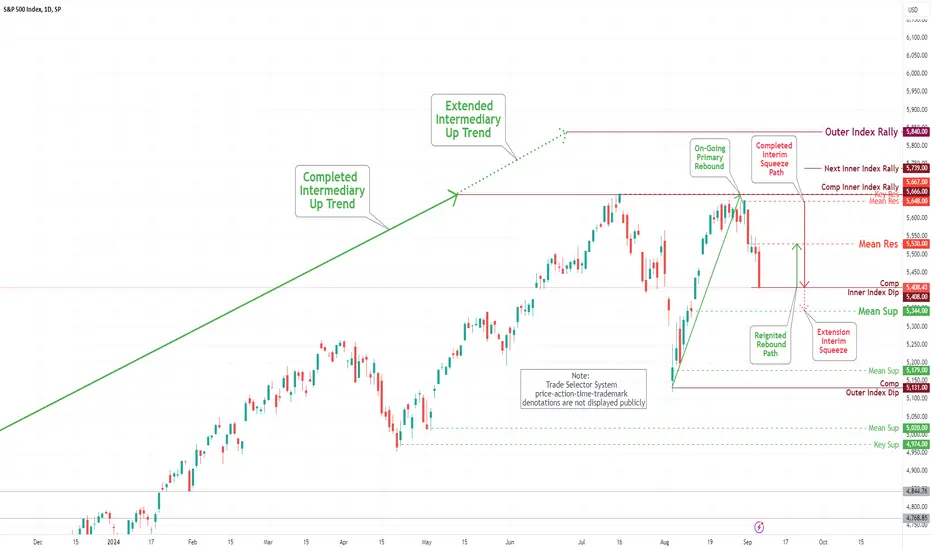
Throughout the trading sessions of the current week, the S&P 500 Index has demonstrated significant downward movement, completing an Inner Index Dip at 5408 and establishing a new Mean Resistance level at 5530. There is a strong likelihood of a rebound to this level. Further, emphasis is placed on achieving the extended downward move to the target marked at Mean Support 5344, where a resilient rebound is anticipated.
Throughout the trading sessions of the current week, the S&P 500 Index has demonstrated significant downward movement, completing an Inner Index Dip at 5408 and establishing a new Mean Resistance level at 5530. There is a strong likelihood of a rebound to this level. Further, emphasis is placed on achieving the extended downward move to the target marked at Mean Support 5344, where a resilient rebound is anticipated.

関連の投稿
免責事項
これらの情報および投稿は、TradingViewが提供または承認する金融、投資、取引、またはその他の種類の助言もしくは推奨であることを意図したものではなく、またこれらに該当するものでもありません。詳細は利用規約をご覧ください。
免責事項
これらの情報および投稿は、TradingViewが提供または承認する金融、投資、取引、またはその他の種類の助言もしくは推奨であることを意図したものではなく、またこれらに該当するものでもありません。詳細は利用規約をご覧ください。