
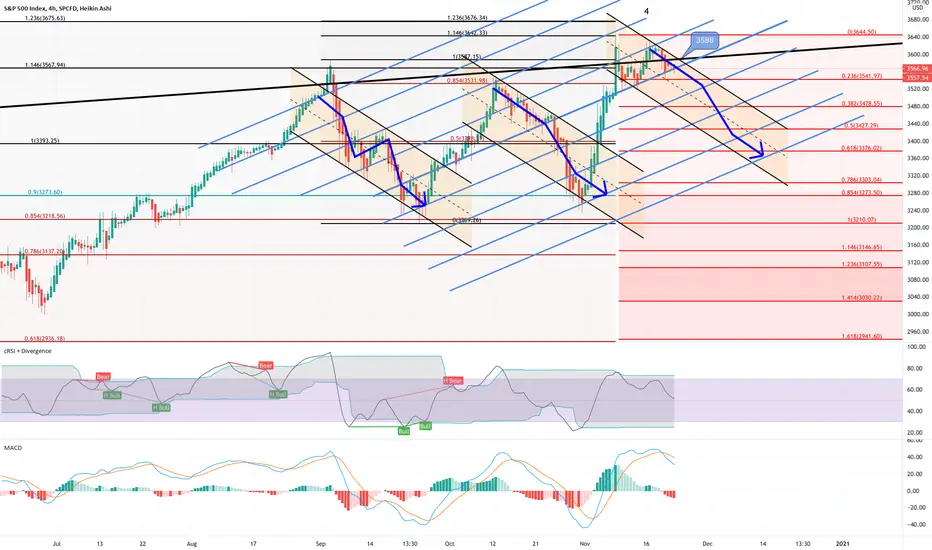
Here is what I see for down channels in the S&P. If this pattern holds, then we should see around 3588 today and then the correction continue. If S&P can break out above that level and hold above it all week, then we could be pushing up to the 1.2 fib ext (3676). However, the RSI and the MACD don't seem to be showing this as a high probability.
ノート
ノート
ノート
That was a quick reversal. Maybe it was a close the morning gap and will bounce back, otherwise that is pretty weak to only hold it for 5-10 minutes.ノート
I totally missed this regression channel. Note how it was rejected back down. This is a clear sign that this market is heading down now.ノート
Touching top edge of both channels. This is prime location for a reversal.ノート
End of day. Went pretty close to my idea.ノート
Big breakout this morning. Looking like it may run for 3628.
関連の投稿
免責事項
これらの情報および投稿は、TradingViewが提供または承認する金融、投資、取引、またはその他の種類の助言もしくは推奨であることを意図したものではなく、またこれらに該当するものでもありません。詳細は利用規約をご覧ください。
関連の投稿
免責事項
これらの情報および投稿は、TradingViewが提供または承認する金融、投資、取引、またはその他の種類の助言もしくは推奨であることを意図したものではなく、またこれらに該当するものでもありません。詳細は利用規約をご覧ください。