
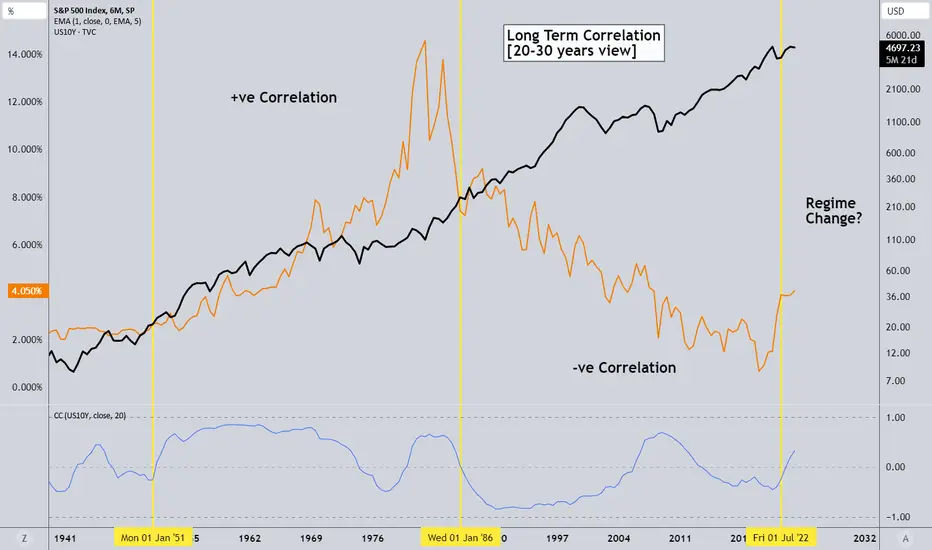
This is comparing between the super trend of the S&P 500 (Cash) index and the US 10 year bond yields.
Previously, for a good 35 years, bond yields and equities shared a strong positive correlation. (1951 to 1986)
Then correlation swung the other way and for the next 37 years, we started seeing negative correlation. Falling yields with equities continuing the advancement.
Question is.. What happens now for the next 30-35 years?
Previously, for a good 35 years, bond yields and equities shared a strong positive correlation. (1951 to 1986)
Then correlation swung the other way and for the next 37 years, we started seeing negative correlation. Falling yields with equities continuing the advancement.
Question is.. What happens now for the next 30-35 years?

Suppose one of you wants to build a tower. Won’t you first sit down and estimate the cost to see if you have enough money to complete it? - Luke 14:28
免責事項
これらの情報および投稿は、TradingViewが提供または承認する金融、投資、取引、またはその他の種類の助言もしくは推奨であることを意図したものではなく、またこれらに該当するものでもありません。詳細は利用規約をご覧ください。
Suppose one of you wants to build a tower. Won’t you first sit down and estimate the cost to see if you have enough money to complete it? - Luke 14:28
免責事項
これらの情報および投稿は、TradingViewが提供または承認する金融、投資、取引、またはその他の種類の助言もしくは推奨であることを意図したものではなく、またこれらに該当するものでもありません。詳細は利用規約をご覧ください。