
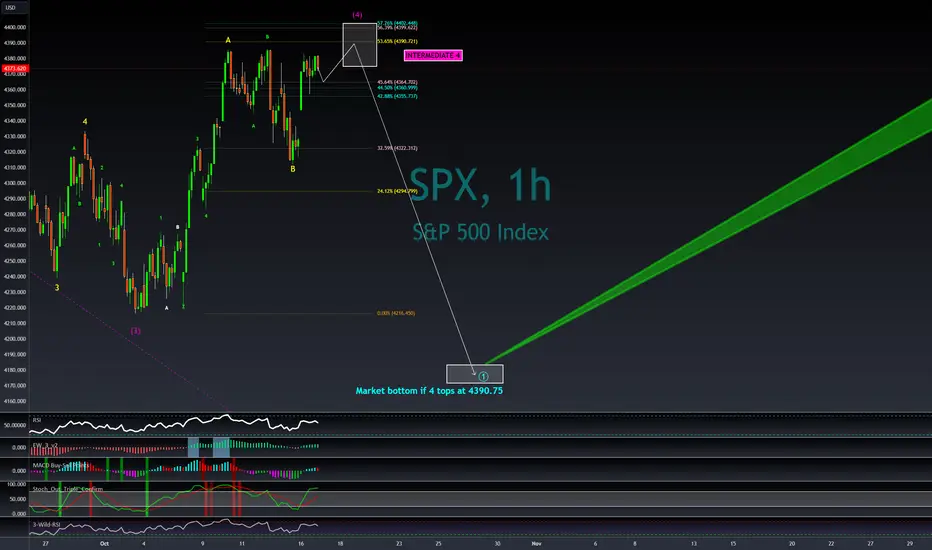
Target boxes are based on derivative analysis of historical waves performance. This will be the first use and test of the new analytical toolset. According to the tool, Intermediate wave 4 does not have much room for the top, looks like ceiling is 4402, which is less than originally expected. Next reversal point will be a low around 4180 which is much higher than originally expected. The timeframe for this low is also pretty quick as Intermediate wave 5 is only expected to last 34-54 trading hours, when Intermediate wave 1 was 112, and Intermediate wave 3 was in the 150s. Once the bottom is in, it will end Primary wave 1 meaning a corrective wave upward will occur over the following weeks which should take the market up through mid- to late-November. 2023 could end on a positive note, however it is masking the damage Primary wave 3 down will do through the first to second quarter of 2024.

All forecasts are based on analysis of past behavior. Prior movements are not always indicative of future movement. Develop the theory, test the theory. Do your own research. Nothing in this analysis constitutes advice. YouTube For More. Good luck!!
関連の投稿
免責事項
これらの情報および投稿は、TradingViewが提供または承認する金融、投資、取引、またはその他の種類の助言もしくは推奨であることを意図したものではなく、またこれらに該当するものでもありません。詳細は利用規約をご覧ください。
All forecasts are based on analysis of past behavior. Prior movements are not always indicative of future movement. Develop the theory, test the theory. Do your own research. Nothing in this analysis constitutes advice. YouTube For More. Good luck!!
関連の投稿
免責事項
これらの情報および投稿は、TradingViewが提供または承認する金融、投資、取引、またはその他の種類の助言もしくは推奨であることを意図したものではなく、またこれらに該当するものでもありません。詳細は利用規約をご覧ください。