
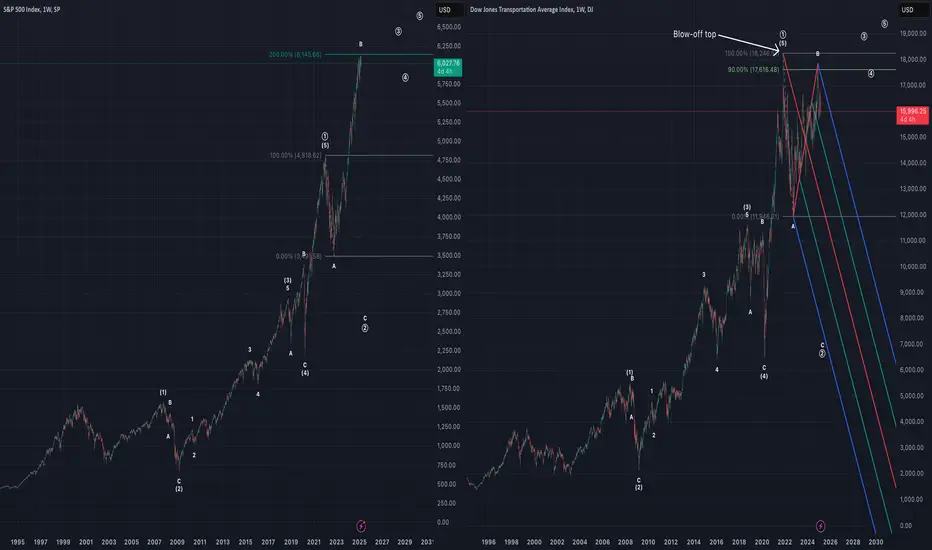
Chart comparing SPX and DJT.
This count has SPX and DJT in wave ((2)) of ((5)), with wave ((2)) of SPX as an expanded flat and wave ((2)) of DJT as a regular flat.
For SPX, wave B of the expanded flat ends up being 200% of wave A (nearly to the tic). For DJT, wave B of the regular flat ends up being ~90% of wave A.
If correct, would expect wave C to target March 2020 lows.
This count has SPX and DJT in wave ((2)) of ((5)), with wave ((2)) of SPX as an expanded flat and wave ((2)) of DJT as a regular flat.
For SPX, wave B of the expanded flat ends up being 200% of wave A (nearly to the tic). For DJT, wave B of the regular flat ends up being ~90% of wave A.
If correct, would expect wave C to target March 2020 lows.

免責事項
これらの情報および投稿は、TradingViewが提供または承認する金融、投資、取引、またはその他の種類の助言もしくは推奨であることを意図したものではなく、またこれらに該当するものでもありません。詳細は利用規約をご覧ください。
免責事項
これらの情報および投稿は、TradingViewが提供または承認する金融、投資、取引、またはその他の種類の助言もしくは推奨であることを意図したものではなく、またこれらに該当するものでもありません。詳細は利用規約をご覧ください。