
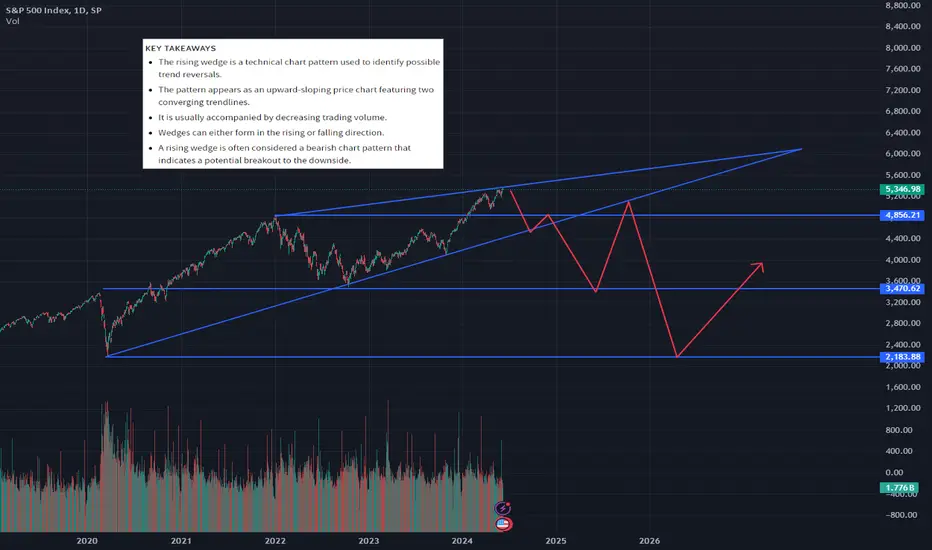
Not only do we have bearish patterns on some shorter term time frames, but we're also seeing it on much larger term time frames as well. This is yet another ascending wedge, but this time it's one that has formed over a 5-6 year period. If it is broken to the downside, the move will most likely be substantial, but it may take a while. Analyzing a 1 week chart showing the past 20 years is a completely different story than what you would see on a 1hr chart showing the last 20 days.
investopedia.com/articles/trading/07/rising_wedge.asp
investopedia.com/articles/trading/07/rising_wedge.asp

You reap what you sow.
VIP Lifetime Access Program:
ko-fi.com/c/0cb5bf9514
Disclaimer:
The ideas I post do not always represent my positions and they are intended for educational purposes. Trading is risky! Most traders lose money.
VIP Lifetime Access Program:
ko-fi.com/c/0cb5bf9514
Disclaimer:
The ideas I post do not always represent my positions and they are intended for educational purposes. Trading is risky! Most traders lose money.
関連の投稿
免責事項
これらの情報および投稿は、TradingViewが提供または承認する金融、投資、取引、またはその他の種類の助言もしくは推奨であることを意図したものではなく、またこれらに該当するものでもありません。詳細は利用規約をご覧ください。
You reap what you sow.
VIP Lifetime Access Program:
ko-fi.com/c/0cb5bf9514
Disclaimer:
The ideas I post do not always represent my positions and they are intended for educational purposes. Trading is risky! Most traders lose money.
VIP Lifetime Access Program:
ko-fi.com/c/0cb5bf9514
Disclaimer:
The ideas I post do not always represent my positions and they are intended for educational purposes. Trading is risky! Most traders lose money.
関連の投稿
免責事項
これらの情報および投稿は、TradingViewが提供または承認する金融、投資、取引、またはその他の種類の助言もしくは推奨であることを意図したものではなく、またこれらに該当するものでもありません。詳細は利用規約をご覧ください。