
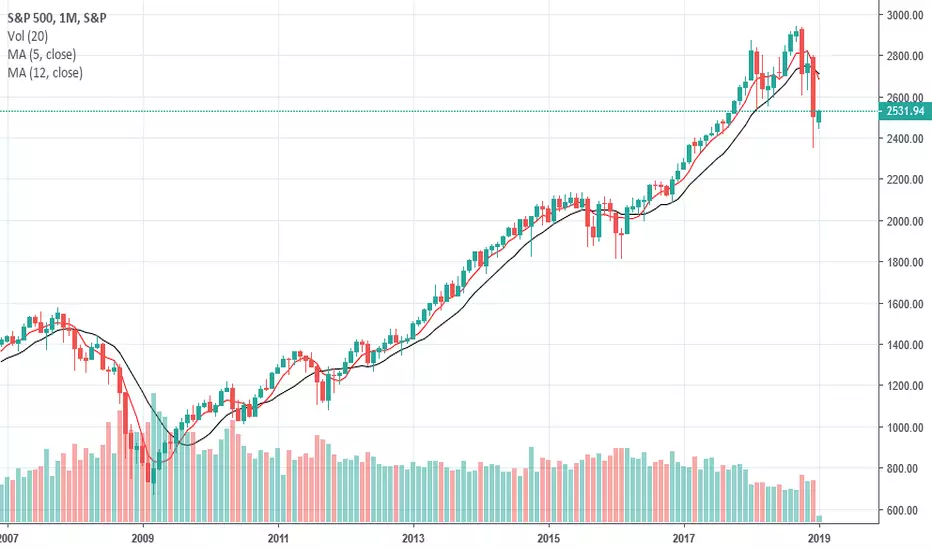
I am not the originator of this idea, but found it on the following website. I created a chart for it so as to get real time indications of short term / long term moving average cross-overs. 5 month is used for short and 12 month for long. This is a market timing indicator.
retirementoptimizer.com/
retirementoptimizer.com/

免責事項
これらの情報および投稿は、TradingViewが提供または承認する金融、投資、取引、またはその他の種類の助言もしくは推奨であることを意図したものではなく、またこれらに該当するものでもありません。詳細は利用規約をご覧ください。
免責事項
これらの情報および投稿は、TradingViewが提供または承認する金融、投資、取引、またはその他の種類の助言もしくは推奨であることを意図したものではなく、またこれらに該当するものでもありません。詳細は利用規約をご覧ください。