
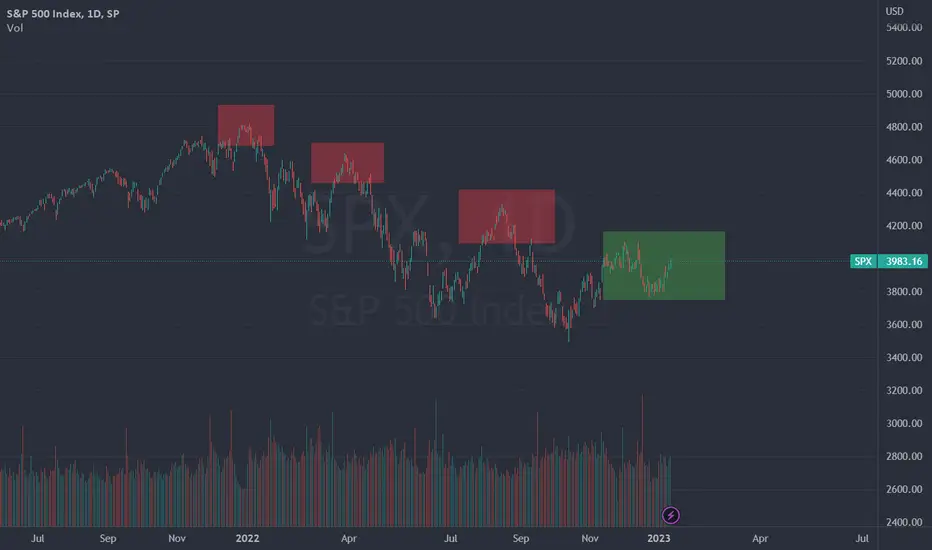
Quick post to those of you who've been following some of my ideas. I had previously drawn the similarity between now and 2008 in terms of chart patterns, but what's playing out seems to be much more like 1968 and 2001. Notice the double tops in green before the crash both had, which closely resembles what we're headed for now. These were also the starts of boom bust cycles happening in sets of 2. With this in mind, I'm adjusting to the 2001 timeline. My new PT is $265 which would hypothetically be at the end of August.


関連の投稿
免責事項
これらの情報および投稿は、TradingViewが提供または承認する金融、投資、取引、またはその他の種類の助言もしくは推奨であることを意図したものではなく、またこれらに該当するものでもありません。詳細は利用規約をご覧ください。
関連の投稿
免責事項
これらの情報および投稿は、TradingViewが提供または承認する金融、投資、取引、またはその他の種類の助言もしくは推奨であることを意図したものではなく、またこれらに該当するものでもありません。詳細は利用規約をご覧ください。