
Technical Analysis and Outlook:
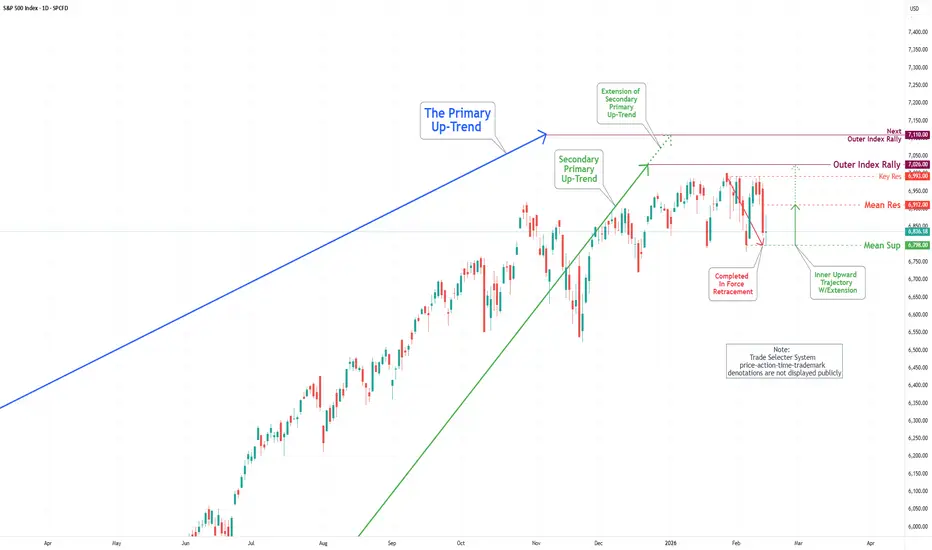
The S&P500 Index exhibited an extraordinary rise and a sharp decline during the trading session this week, reflecting one of the most vigorous moves in recent trading activity. On the upside, it has met our target at Key Resistance 6,993 and has crashed sharply to Mean Support 6,798.
It is anticipated that the S&P500 Index will continue its upward trajectory toward the Mean Resistance at 6,912, with the ultimate goal of reaching our awaited outcome of an Outer Index Rally at 7,026.
Nevertheless, it is imperative to acknowledge that there is a substantial likelihood of a retracement retest that will lead to revisiting the Mean Support at 6,798 before the Index regains its bullish momentum.
The S&P500 Index exhibited an extraordinary rise and a sharp decline during the trading session this week, reflecting one of the most vigorous moves in recent trading activity. On the upside, it has met our target at Key Resistance 6,993 and has crashed sharply to Mean Support 6,798.
It is anticipated that the S&P500 Index will continue its upward trajectory toward the Mean Resistance at 6,912, with the ultimate goal of reaching our awaited outcome of an Outer Index Rally at 7,026.
Nevertheless, it is imperative to acknowledge that there is a substantial likelihood of a retracement retest that will lead to revisiting the Mean Support at 6,798 before the Index regains its bullish momentum.

関連の投稿
免責事項
これらの情報および投稿は、TradingViewが提供または承認する金融、投資、取引、またはその他の種類の助言もしくは推奨であることを意図したものではなく、またこれらに該当するものでもありません。詳細は利用規約をご覧ください。
免責事項
これらの情報および投稿は、TradingViewが提供または承認する金融、投資、取引、またはその他の種類の助言もしくは推奨であることを意図したものではなく、またこれらに該当するものでもありません。詳細は利用規約をご覧ください。