
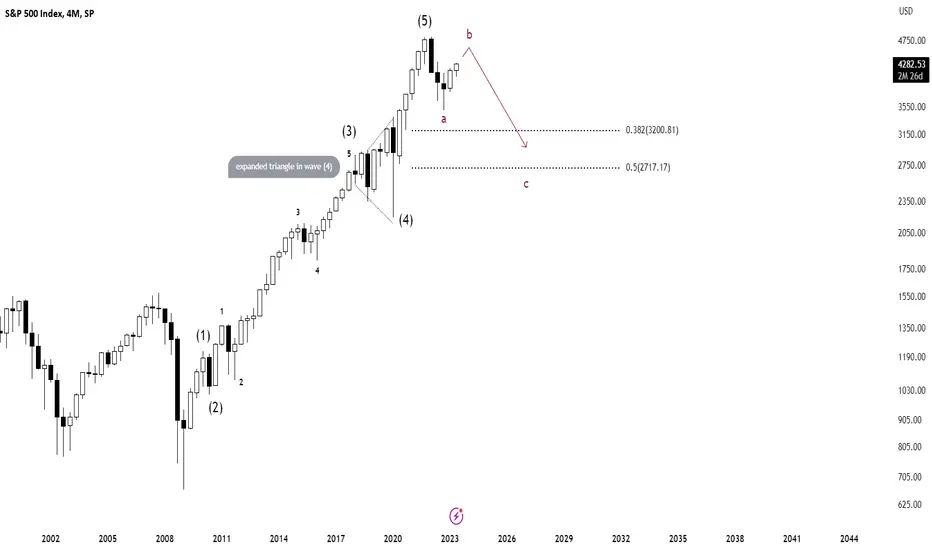
The idea is based on the Elliott Wave Theory. The analysis suggests that an impulse cycle is completed which started in Jan 2009. Based on this count, we are likely to see one more wave down (c) which completes the correction cycle.
The minimum correction point would be 38.2 fib which is at 3200 and then the 50% fib (2700 level).
Wave b often takes time to complete and difficult to predict with accuracy. We may see a close to double-top situation followed by a reversal downwards. It's necessary to manage risk while trading or Investing.

免責事項
これらの情報および投稿は、TradingViewが提供または承認する金融、投資、取引、またはその他の種類の助言もしくは推奨であることを意図したものではなく、またこれらに該当するものでもありません。詳細は利用規約をご覧ください。
免責事項
これらの情報および投稿は、TradingViewが提供または承認する金融、投資、取引、またはその他の種類の助言もしくは推奨であることを意図したものではなく、またこれらに該当するものでもありません。詳細は利用規約をご覧ください。