
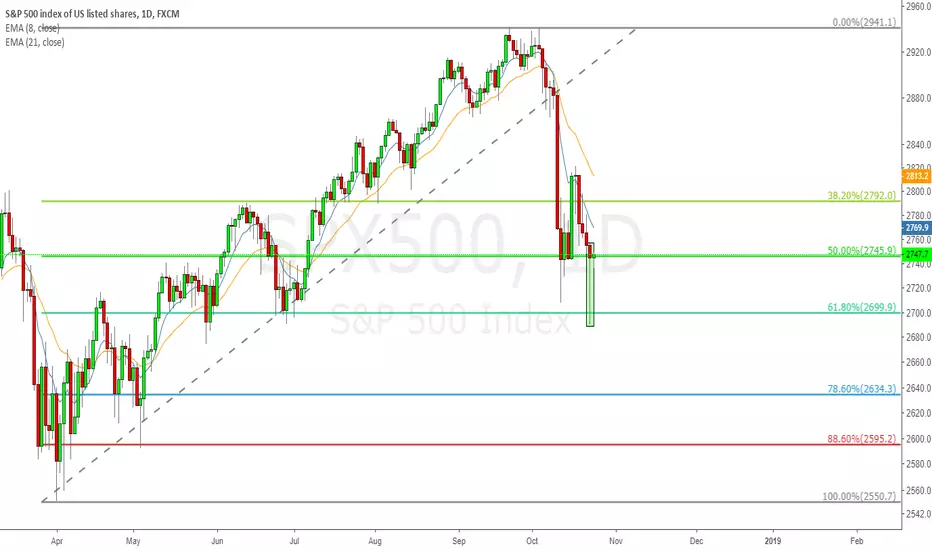
A very very important set-up that I believe stock traders over the world are talking about how to deal with this daily hammer.
For me, quite simple that it's almost a perfect combination.
Whatever the result is, this set-up definitely worth some long trades!
Breakout, pullback, intraday momentum trades, and etc...
Also I'll take this perspective into individual stocks to look for buy-low opportunities!
Let's see how it goes!
For me, quite simple that it's almost a perfect combination.
Whatever the result is, this set-up definitely worth some long trades!
Breakout, pullback, intraday momentum trades, and etc...
Also I'll take this perspective into individual stocks to look for buy-low opportunities!
Let's see how it goes!
ノート
Pull back mode, pay attention to the 0.618 spot @ 2715 yo
ノート
while, in terms of pullback, price action uses 50% and Fib uses 0.618 to trade a hammer,
In this case, those price action guys already get on the train but not yet the fibs lol.
ノート
the bulls tried twice (50% of the pin / intraday bullish harmonic patterns)
both could be successful trades and then made a new low to break the hammer.
Turning bearish until a clear bullish reversal sign yo!

関連の投稿
免責事項
これらの情報および投稿は、TradingViewが提供または承認する金融、投資、取引、またはその他の種類の助言もしくは推奨であることを意図したものではなく、またこれらに該当するものでもありません。詳細は利用規約をご覧ください。
免責事項
これらの情報および投稿は、TradingViewが提供または承認する金融、投資、取引、またはその他の種類の助言もしくは推奨であることを意図したものではなく、またこれらに該当するものでもありません。詳細は利用規約をご覧ください。