
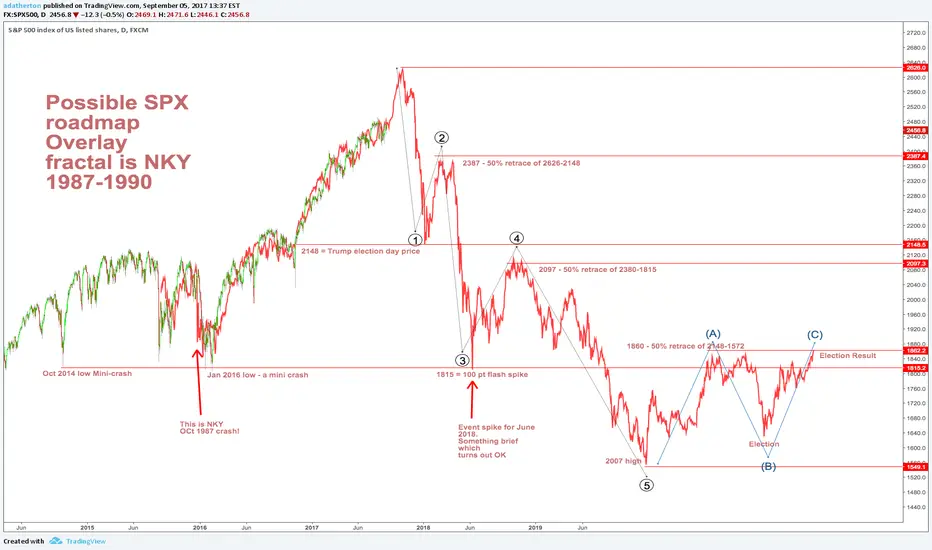
This is based on the Nikkei 225 price action from late 1987 to 1990. The existing action fits well, we are now at early November 1989.
This chart presumes one more fast ramp by SPX to 2620, then a sharp 18% fall wiping out all the Trump gains. This would be followed by a 50% rebound, and then further falls into the next few years, eventually reaching the 2007 high of 1572.
This chart presumes one more fast ramp by SPX to 2620, then a sharp 18% fall wiping out all the Trump gains. This would be followed by a 50% rebound, and then further falls into the next few years, eventually reaching the 2007 high of 1572.

免責事項
これらの情報および投稿は、TradingViewが提供または承認する金融、投資、取引、またはその他の種類の助言もしくは推奨であることを意図したものではなく、またこれらに該当するものでもありません。詳細は利用規約をご覧ください。
免責事項
これらの情報および投稿は、TradingViewが提供または承認する金融、投資、取引、またはその他の種類の助言もしくは推奨であることを意図したものではなく、またこれらに該当するものでもありません。詳細は利用規約をご覧ください。