
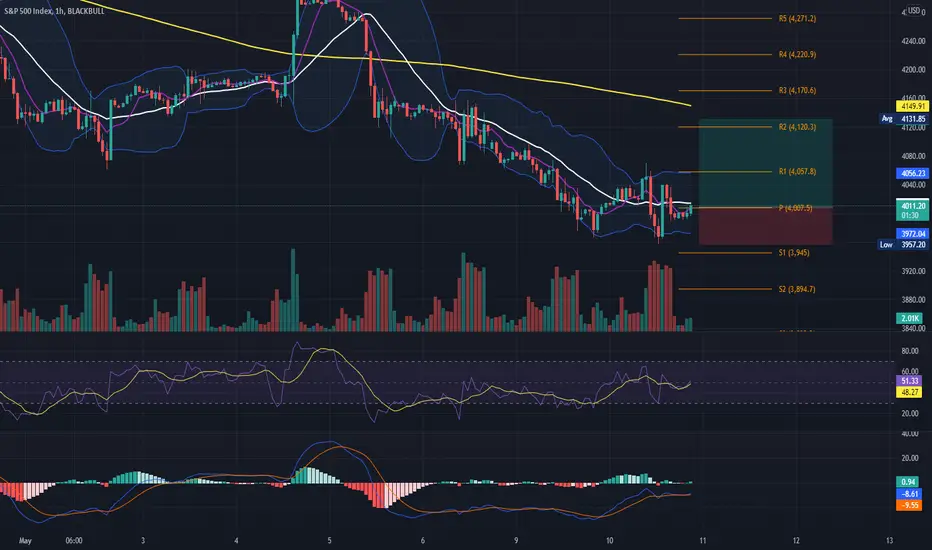
Hey traders, SPX is showing the last correction wave C 1-day frame, which is almost over. The market is bearish, we will see the market going slowly higher, bouncing between the pivot point bands and going up.
Pls remember to check the trend, the price should stay up at the pivot point level and bounce in it, without breaking. If the price goes down the pivot point and then S1, we will switch into a downtrend again.
Pls , see the pivot point levels in the chart.(R1,R2) The market has the last word.
Indicators, MA 200, 20-8 RSI 8 MA8 Bollinger 20, Volume , Pivot points Levels. Intraday Strategy. MACD

免責事項
これらの情報および投稿は、TradingViewが提供または承認する金融、投資、取引、またはその他の種類の助言もしくは推奨であることを意図したものではなく、またこれらに該当するものでもありません。詳細は利用規約をご覧ください。
免責事項
これらの情報および投稿は、TradingViewが提供または承認する金融、投資、取引、またはその他の種類の助言もしくは推奨であることを意図したものではなく、またこれらに該当するものでもありません。詳細は利用規約をご覧ください。