
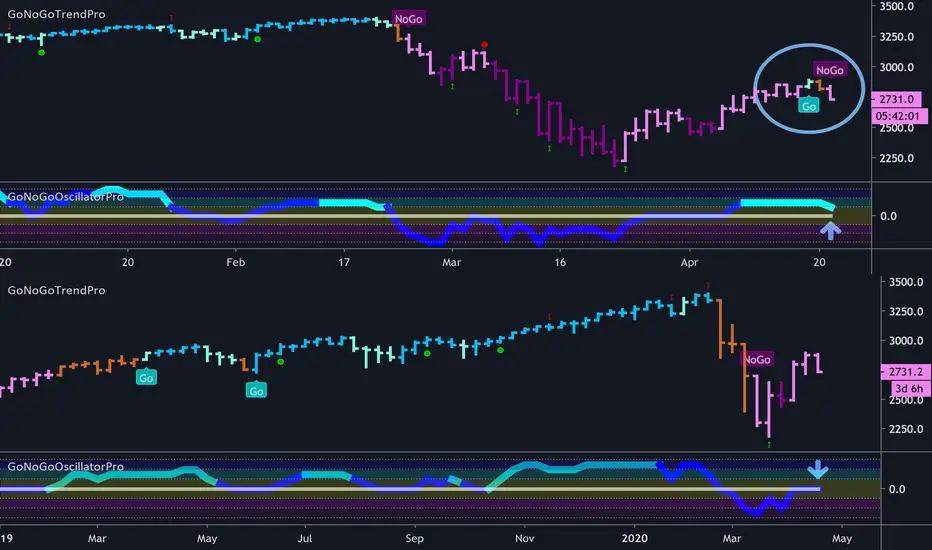
The GoNoGo Trend indicator on S&P 500 daily data was able to briefly paint a blue "Go" bar 2 days ago. See the top chart, area circled. However, it immediately painted an amber neutral bar followed by a quick return to the current "NoGo" color. This shows lack of conviction in any change of trend. The GoNoGo Oscillator is heading back to zero, highlighted with an arrow. For there to be any return to a "Go" environment the oscillator should find support at zero.
When there is uncertainty in one time frame it often is beneficial to look to the larger trend. The lower chart is the GoNoGo chart on S&P 500 weekly data. The trend is still a "NoGo" as depicted by the bearish purple and pink bars of the GoNoGo Trend indicator.
The GoNoGo Oscillator is at a pivotal point, hitting the zero line from below. Again, highlighted with an arrow. If this resistance holds, and the oscillator is turned away from zero, we'd expect the daily to continue to move down and stay a "NoGo".
When there is uncertainty in one time frame it often is beneficial to look to the larger trend. The lower chart is the GoNoGo chart on S&P 500 weekly data. The trend is still a "NoGo" as depicted by the bearish purple and pink bars of the GoNoGo Trend indicator.
The GoNoGo Oscillator is at a pivotal point, hitting the zero line from below. Again, highlighted with an arrow. If this resistance holds, and the oscillator is turned away from zero, we'd expect the daily to continue to move down and stay a "NoGo".

免責事項
これらの情報および投稿は、TradingViewが提供または承認する金融、投資、取引、またはその他の種類の助言もしくは推奨であることを意図したものではなく、またこれらに該当するものでもありません。詳細は利用規約をご覧ください。
免責事項
これらの情報および投稿は、TradingViewが提供または承認する金融、投資、取引、またはその他の種類の助言もしくは推奨であることを意図したものではなく、またこれらに該当するものでもありません。詳細は利用規約をご覧ください。