
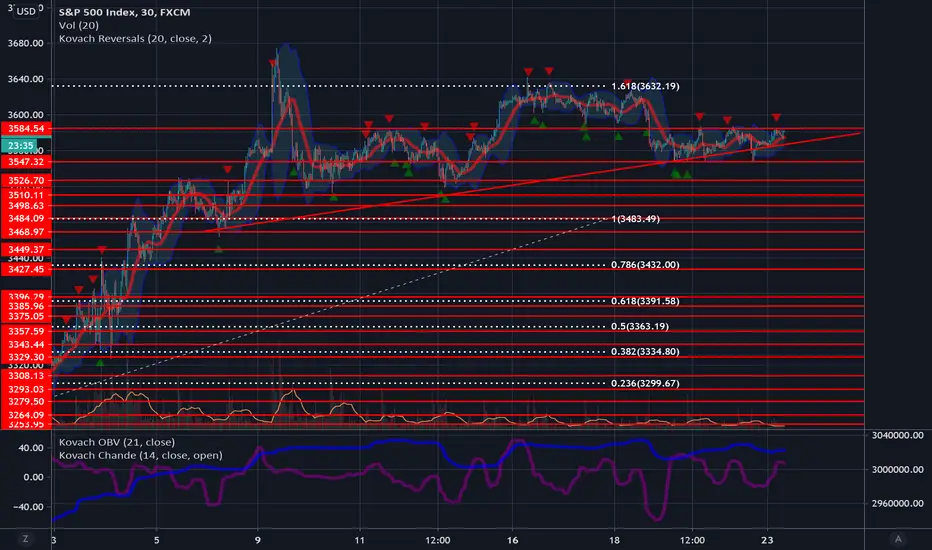
Stocks continue to range, holding the very narrow range 3547 to 3584. If they break to the upside they will face resistance at the Fibonacci extension level 3632, which provided resistance last week. Highs at 3677 will also be difficult to break. The S&P still looks like it is forming a bull wedge pattern. We are currently sitting at support from the lower bound. If our buy-side conviction fails, we could see a breakdown to as low as 3484, but we need to slice through several levels first.

Join my discord at discord.io/quantguy
関連の投稿
免責事項
これらの情報および投稿は、TradingViewが提供または承認する金融、投資、取引、またはその他の種類の助言もしくは推奨であることを意図したものではなく、またこれらに該当するものでもありません。詳細は利用規約をご覧ください。
Join my discord at discord.io/quantguy
関連の投稿
免責事項
これらの情報および投稿は、TradingViewが提供または承認する金融、投資、取引、またはその他の種類の助言もしくは推奨であることを意図したものではなく、またこれらに該当するものでもありません。詳細は利用規約をご覧ください。