
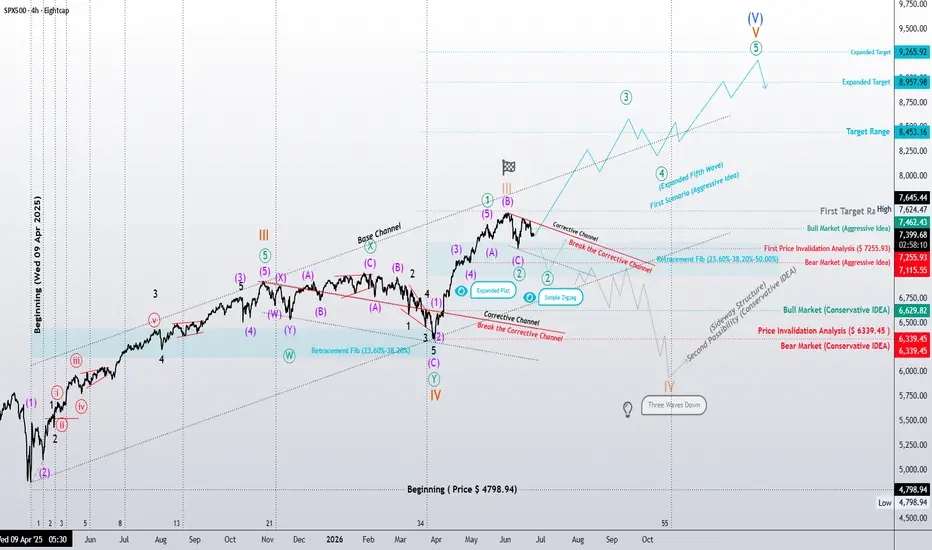
SPX500 4H Strategic Analysis
Attention Traders,
Here is my latest deep-dive into the SPX500 4H chart. We aren’t just looking at price action; we are reading the “blueprint” of market energy.
Technical Breakdown:
The current structure presents two high-probability paths:
The Aggressive Scenario: A potential Expanded 5th Wave completion, targeting key liquidity zones at 8,957 and potentially reaching as high as 9,265.
The Conservative Scenario: A transition into a larger Wave IV sideways structure (potentially a Flat or Triangle), which could see a deeper correction toward the 6,339 level.
The Macro Edge (The Secret Sauce):
The real alpha lies in the DXY-SPX500 Correlation. We are monitoring the interplay between the US Dollar Index and Equities. Currently, as long as the DXY remains in its macro Wave 1/2 buildup, the SPX500 can maintain its bullish trajectory. However, we must be prepared for the “Energy Shift”—the moment DXY enters its explosive Wave 3, which typically triggers a major corrective phase in the equity markets.
Final Outlook:
What we are witnessing is a “minimal progression” phase, setting the stage for a much larger convergence. Stay disciplined and watch the levels.
Disclaimer: This analysis is for educational purposes only and does not constitute financial advice.
Attention Traders,
Here is my latest deep-dive into the SPX500 4H chart. We aren’t just looking at price action; we are reading the “blueprint” of market energy.
Technical Breakdown:
The current structure presents two high-probability paths:
The Aggressive Scenario: A potential Expanded 5th Wave completion, targeting key liquidity zones at 8,957 and potentially reaching as high as 9,265.
The Conservative Scenario: A transition into a larger Wave IV sideways structure (potentially a Flat or Triangle), which could see a deeper correction toward the 6,339 level.
The Macro Edge (The Secret Sauce):
The real alpha lies in the DXY-SPX500 Correlation. We are monitoring the interplay between the US Dollar Index and Equities. Currently, as long as the DXY remains in its macro Wave 1/2 buildup, the SPX500 can maintain its bullish trajectory. However, we must be prepared for the “Energy Shift”—the moment DXY enters its explosive Wave 3, which typically triggers a major corrective phase in the equity markets.
Final Outlook:
What we are witnessing is a “minimal progression” phase, setting the stage for a much larger convergence. Stay disciplined and watch the levels.
Disclaimer: This analysis is for educational purposes only and does not constitute financial advice.

関連の投稿
免責事項
これらの情報および投稿は、TradingViewが提供または承認する金融、投資、取引、またはその他の種類の助言もしくは推奨であることを意図したものではなく、またこれらに該当するものでもありません。詳細は利用規約をご覧ください。
免責事項
これらの情報および投稿は、TradingViewが提供または承認する金融、投資、取引、またはその他の種類の助言もしくは推奨であることを意図したものではなく、またこれらに該当するものでもありません。詳細は利用規約をご覧ください。