
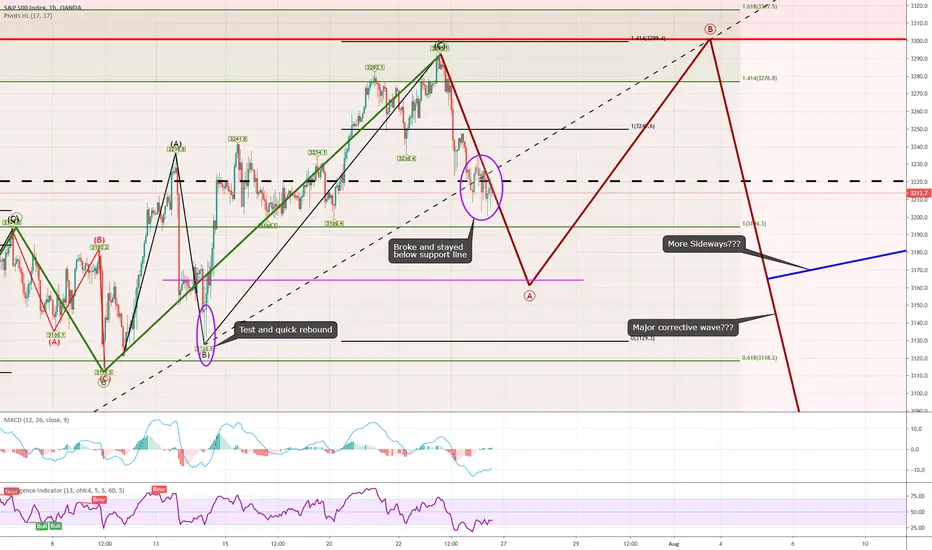
S&P 500 broke the support line yesterday and stayed under all day. This was not a test like previously. This is an indication that we are going to see a corrective wave sequence. A common pattern is for it to be symmetric about the support line for Wave A and Wave B to use the support line as a new resistance line. The height of Wave B is hard to know. I would guess around the previous ATH. Could go a touch higher if their is a enough momentum (max = 1.2 of Wave A). Not clear what comes after that for Wave C. It could be a small correction that will keep market going sideways or we could see a full corrective wave that could take us down to or past the March low.

関連の投稿
免責事項
これらの情報および投稿は、TradingViewが提供または承認する金融、投資、取引、またはその他の種類の助言もしくは推奨であることを意図したものではなく、またこれらに該当するものでもありません。詳細は利用規約をご覧ください。
関連の投稿
免責事項
これらの情報および投稿は、TradingViewが提供または承認する金融、投資、取引、またはその他の種類の助言もしくは推奨であることを意図したものではなく、またこれらに該当するものでもありません。詳細は利用規約をご覧ください。