
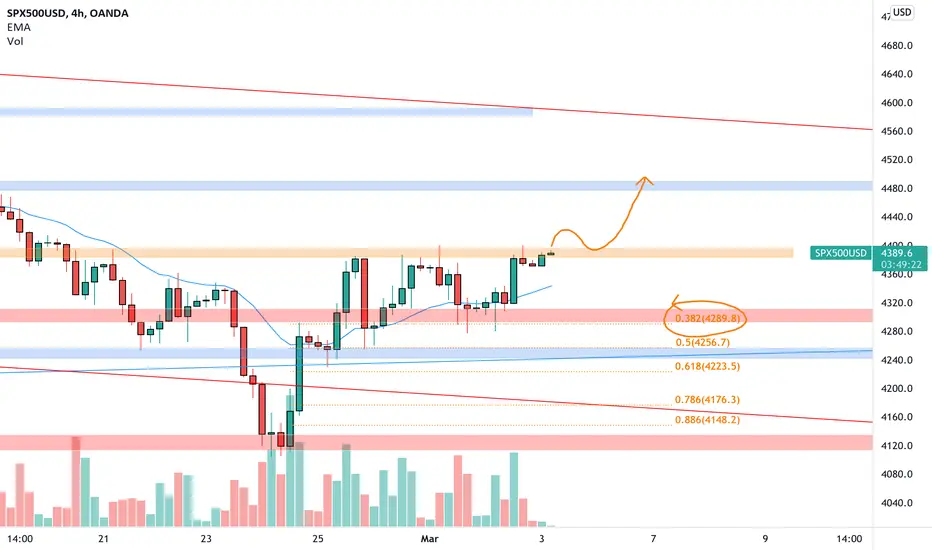
SP500 on the 4h chart tested perfectly the weekly resistance creating a recent low.
We can see how volumes of bulls kicked in at the price and the market started to move higher again.
Currently, the market reached the 4400 level and starts to bounce between the resistance level and the 0.382 Fibonacci support.
How can we approach this scenario?
We will wait for a break above the resistance area, after that we will search for a nice long entry point according to Plancton's strategy rules.
––––
Follow the Shrimp 🦐
Keep in mind.
• 🟣 Purple structure -> Monthly structure.
• 🔴 Red structure -> Weekly structure.
• 🔵 Blue structure -> Daily structure.
• 🟡 Yellow structure -> 4h structure.
• ⚫️ Black structure -> >4h structure.
Here is the Plancton0618 technical analysis , please comment below if you have any question.
The ENTRY in the market will be taken only if the condition of the Plancton0618 strategy will trigger.
We can see how volumes of bulls kicked in at the price and the market started to move higher again.
Currently, the market reached the 4400 level and starts to bounce between the resistance level and the 0.382 Fibonacci support.
How can we approach this scenario?
We will wait for a break above the resistance area, after that we will search for a nice long entry point according to Plancton's strategy rules.
––––
Follow the Shrimp 🦐
Keep in mind.
• 🟣 Purple structure -> Monthly structure.
• 🔴 Red structure -> Weekly structure.
• 🔵 Blue structure -> Daily structure.
• 🟡 Yellow structure -> 4h structure.
• ⚫️ Black structure -> >4h structure.
Here is the Plancton0618 technical analysis , please comment below if you have any question.
The ENTRY in the market will be taken only if the condition of the Plancton0618 strategy will trigger.
ノート

免責事項
これらの情報および投稿は、TradingViewが提供または承認する金融、投資、取引、またはその他の種類の助言もしくは推奨であることを意図したものではなく、またこれらに該当するものでもありません。詳細は利用規約をご覧ください。
免責事項
これらの情報および投稿は、TradingViewが提供または承認する金融、投資、取引、またはその他の種類の助言もしくは推奨であることを意図したものではなく、またこれらに該当するものでもありません。詳細は利用規約をご覧ください。