
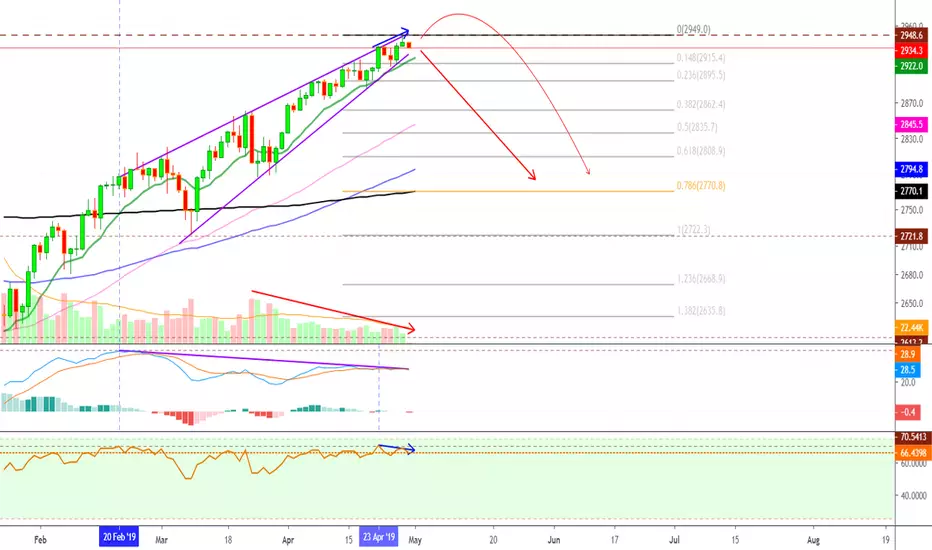
The S&P 500 Index (SPX500USD) has reached a new all-time high while weakness signals continue to pop up all over the place.
The MACD continues descending and going lower:
Bearish divergence is now showing on the RSI from the 23rd to the 29th April, marked with a blue arrow...
How much longer can this go?
Let us know in the comments section below!
We are still expecting for this index to drop according to the signals just mentioned.
Thanks a lot for reading.
This is Alan Masters.
Namaste.
The MACD continues descending and going lower:
Bearish divergence is now showing on the RSI from the 23rd to the 29th April, marked with a blue arrow...
How much longer can this go?
Let us know in the comments section below!
We are still expecting for this index to drop according to the signals just mentioned.
Thanks a lot for reading.
This is Alan Masters.
Namaste.
ノート
Apple Inc (AAPL)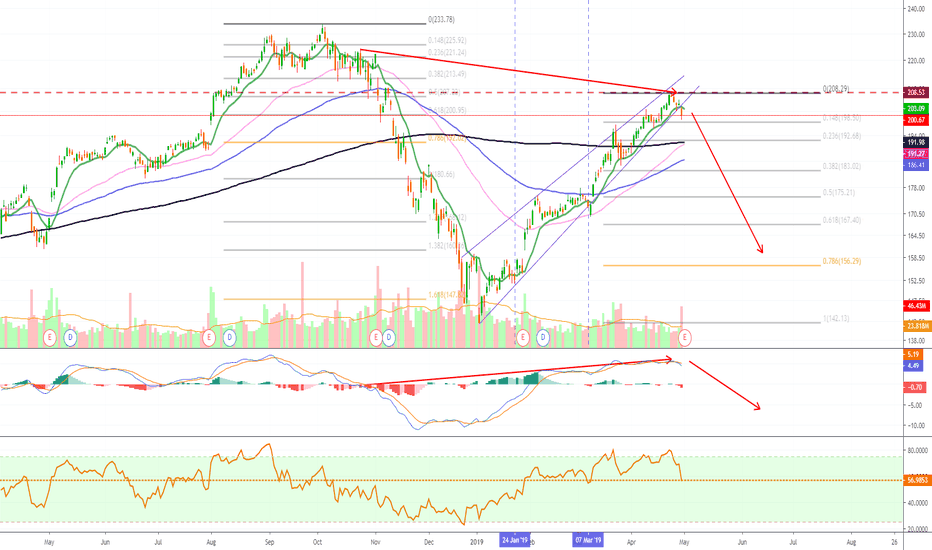
ノート
Is this it? Only time will tell: ノート
Latest update: 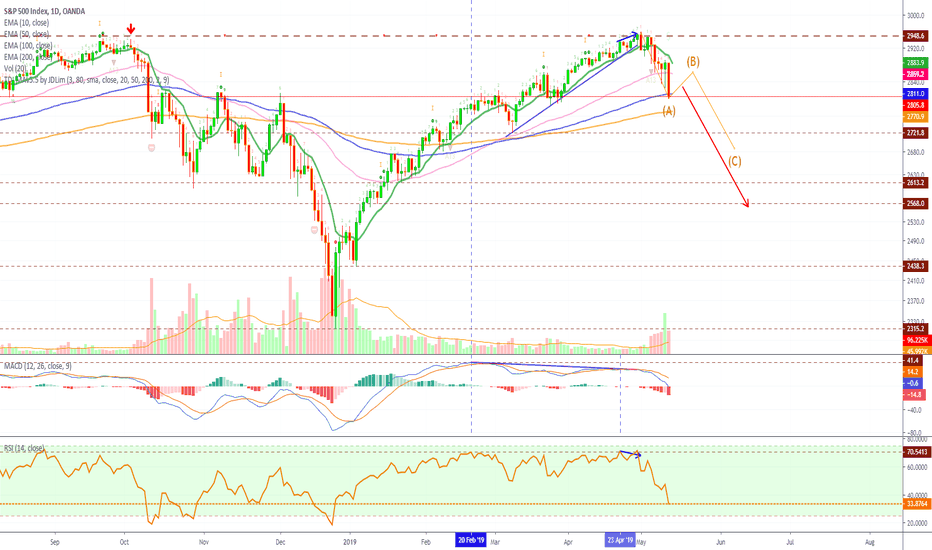
ノート
More updates:DJI
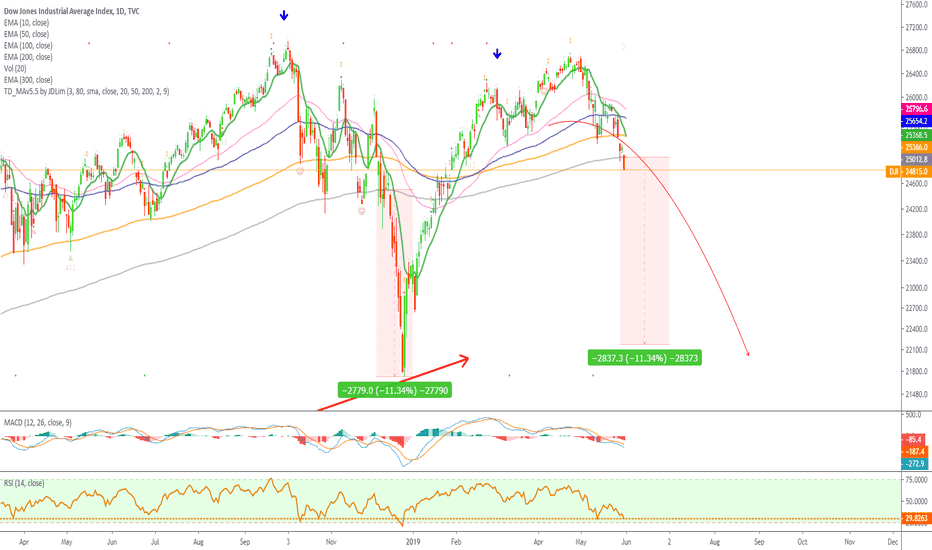
SPX


Trading Cryptocurrencies can be the hardest undertaking ever without the right trade-numbers, without accurate private-access information. Free is free, but the best always requires sweat, an investment. Since 2017 👇
t.me/masteranandatrades/8778
t.me/masteranandatrades/8778
関連の投稿
免責事項
これらの情報および投稿は、TradingViewが提供または承認する金融、投資、取引、またはその他の種類の助言もしくは推奨であることを意図したものではなく、またこれらに該当するものでもありません。詳細は利用規約をご覧ください。
Trading Cryptocurrencies can be the hardest undertaking ever without the right trade-numbers, without accurate private-access information. Free is free, but the best always requires sweat, an investment. Since 2017 👇
t.me/masteranandatrades/8778
t.me/masteranandatrades/8778
関連の投稿
免責事項
これらの情報および投稿は、TradingViewが提供または承認する金融、投資、取引、またはその他の種類の助言もしくは推奨であることを意図したものではなく、またこれらに該当するものでもありません。詳細は利用規約をご覧ください。