As I expected in the previous idea, the S&P 500 index( SPX500) reached its targets(Full Target Done).
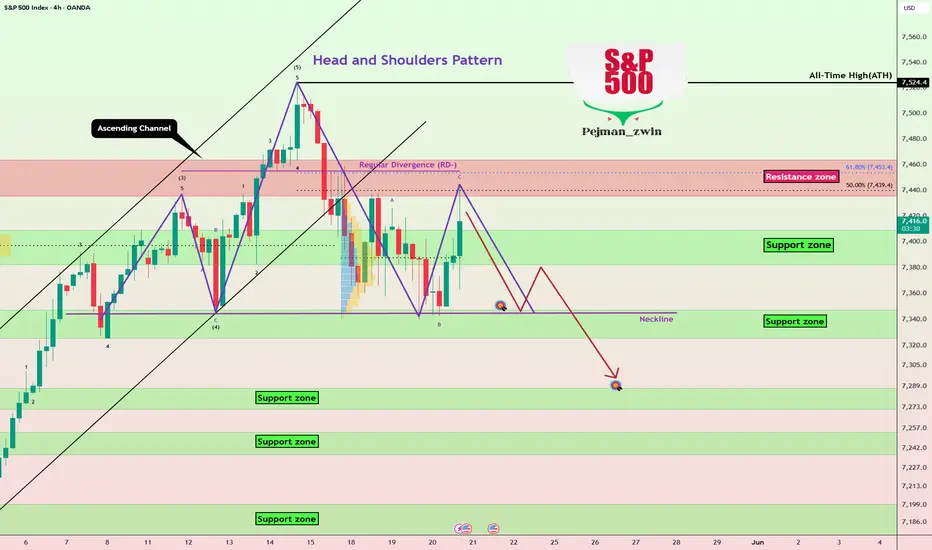
The S&P 500 index has once again approached the resistance zone($7,464-$$7,435), but has lost its ascending channel, which could be a sign of weakness in the upward trend for this index.
From a classical technical analysis perspective, it seems that the S&P 500 could complete the Head and Shoulders Pattern after breaking the ascending channel.
From an Elliott wave theory perspective, it seems that the S&P 500 should experience more corrective waves.
I expect the S&P 500 to decline to at least $7,351 after breaking the important trading level of $7,400. And if the neckline is broken, we should expect further declines.
First Target: $7,351
Second Target: $7,303
Stop Loss(SL): $7,473
What’s your view on the S&P 500? Can it resume its bullish trend, or should we expect a deeper correction?
Note: If tensions escalate in the Middle East in the coming days, we could see further declines in the S&P 500, similar to what happened yesterday. However, from a technical perspective, the index does appear to need a price correction.
💡 Please respect each other's opinions and express agreement or disagreement politely.
📌 S&P 500 Index Analyze (SPX500USD), 4-hour time frame.
🛑 Always set a Stop Loss(SL) for every position you open.
✅ This is just my idea; I’d love to see your thoughts too!
🔥 If you find it helpful, please BOOST this post and share it with your friends.
SPX500) reached its targets(Full Target Done).The S&P 500 index has once again approached the resistance zone($7,464-$$7,435), but has lost its ascending channel, which could be a sign of weakness in the upward trend for this index.
From a classical technical analysis perspective, it seems that the S&P 500 could complete the Head and Shoulders Pattern after breaking the ascending channel.
From an Elliott wave theory perspective, it seems that the S&P 500 should experience more corrective waves.
I expect the S&P 500 to decline to at least $7,351 after breaking the important trading level of $7,400. And if the neckline is broken, we should expect further declines.
First Target: $7,351
Second Target: $7,303
Stop Loss(SL): $7,473
What’s your view on the S&P 500? Can it resume its bullish trend, or should we expect a deeper correction?
Note: If tensions escalate in the Middle East in the coming days, we could see further declines in the S&P 500, similar to what happened yesterday. However, from a technical perspective, the index does appear to need a price correction.
💡 Please respect each other's opinions and express agreement or disagreement politely.
📌 S&P 500 Index Analyze (SPX500USD), 4-hour time frame.
🛑 Always set a Stop Loss(SL) for every position you open.
✅ This is just my idea; I’d love to see your thoughts too!
🔥 If you find it helpful, please BOOST this post and share it with your friends.
トレード稼働中
Trade was activated in resistance zone($7,464-$$7,435トレード終了: ストップロスに到達
With the news of a possible agreement between Iran and the US, the SPX500 index began to rise, but this increase could probably create a false break above the resistance zone($7,464-$$7,435).
🚀 Up to 75% Trading Fee Rebates Across 20+ Exchanges:
🤖 t.me/Protrader365bot
-----
🎁 Free VIP Forex and Crypto Signals, please visit:
🔗 t.me/ProTrader_365
🤖 t.me/Protrader365bot
-----
🎁 Free VIP Forex and Crypto Signals, please visit:
🔗 t.me/ProTrader_365
関連の投稿
免責事項
これらの情報および投稿は、TradingViewが提供または承認する金融、投資、取引、またはその他の種類の助言もしくは推奨であることを意図したものではなく、またこれらに該当するものでもありません。詳細は利用規約をご覧ください。
🚀 Up to 75% Trading Fee Rebates Across 20+ Exchanges:
🤖 t.me/Protrader365bot
-----
🎁 Free VIP Forex and Crypto Signals, please visit:
🔗 t.me/ProTrader_365
🤖 t.me/Protrader365bot
-----
🎁 Free VIP Forex and Crypto Signals, please visit:
🔗 t.me/ProTrader_365
関連の投稿
免責事項
これらの情報および投稿は、TradingViewが提供または承認する金融、投資、取引、またはその他の種類の助言もしくは推奨であることを意図したものではなく、またこれらに該当するものでもありません。詳細は利用規約をご覧ください。