
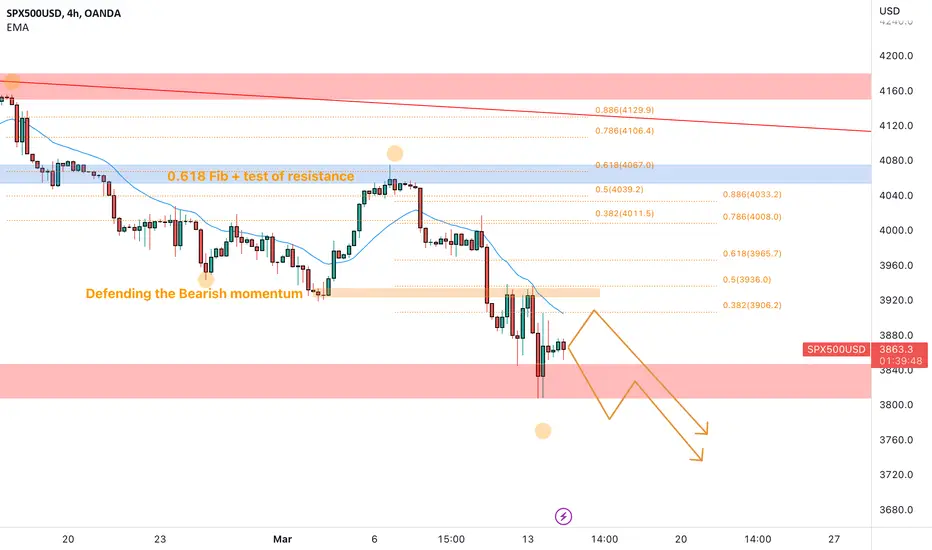
Based on the 4-hour timeframe, there are clear indications of a bearish trend in the S&P 500 index. After testing the weekly resistance level at 4160, the market started a bearish move with a series of lower lows and lower highs.
Further analysis shows that the market retraced to the 0.618 Fibonacci level after the first bearish impulse and tested a daily resistance level perfectly. This level is known as an inversion point, indicating a high likelihood of the market reversing its trend.
From there, the price created a second impulse toward the lower weekly support, indicating a continuation of the bearish trend.
As such, it may be wise to wait for a new opportunity to set a nice short order in anticipation of further price declines according to the Plancton's strategy rules.
Further analysis shows that the market retraced to the 0.618 Fibonacci level after the first bearish impulse and tested a daily resistance level perfectly. This level is known as an inversion point, indicating a high likelihood of the market reversing its trend.
From there, the price created a second impulse toward the lower weekly support, indicating a continuation of the bearish trend.
As such, it may be wise to wait for a new opportunity to set a nice short order in anticipation of further price declines according to the Plancton's strategy rules.
ノート
ノート

免責事項
これらの情報および投稿は、TradingViewが提供または承認する金融、投資、取引、またはその他の種類の助言もしくは推奨であることを意図したものではなく、またこれらに該当するものでもありません。詳細は利用規約をご覧ください。
免責事項
これらの情報および投稿は、TradingViewが提供または承認する金融、投資、取引、またはその他の種類の助言もしくは推奨であることを意図したものではなく、またこれらに該当するものでもありません。詳細は利用規約をご覧ください。