
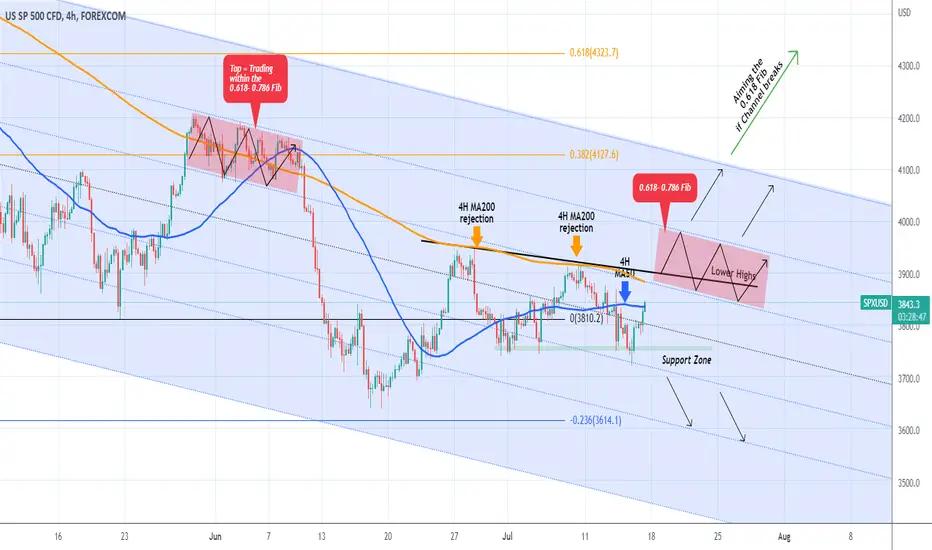
The S&P500 index has been trading mostly sideways since the June 27 High. The pattern that stands out during that time is a Triangle, with the price keeping (and rebounding since yesterday on) the 3750 Support intact (closed all 4H candles above it). The top of the Triangle involves a Lower Highs trend-line, approximately on the same path of the 4H MA200 (orange trend-line) that already has two clear rejections on the patterns Lower Highs.
At the moment the price is testing the 4H MA50 (blue trend-line) and naturally if broken a 4H MA200 test should follow. There are many Resistance levels up ahead, even if we close above the 4H MA200, we need to consider the Resistance strength of the 0.618-0.786 Fibonacci zones of the Channel Down (remember it is the dominant pattern throughout the whole year when the correction started).
The short-term strategy is to take one Resistance at a time and target the higher levels only if we get a clear 4H candle closing above the current Resistance at hand. In the same notion, a break above the Channel Down, which is approximately where the 0.382 Fib is, targets the 0.618 level at around 4320. Similarly a closing below the 3750 Support, targets the 0.236 Fibonacci level.
--------------------------------------------------------------------------------------------------------
Please like, subscribe and share your ideas and charts with the community!
--------------------------------------------------------------------------------------------------------
At the moment the price is testing the 4H MA50 (blue trend-line) and naturally if broken a 4H MA200 test should follow. There are many Resistance levels up ahead, even if we close above the 4H MA200, we need to consider the Resistance strength of the 0.618-0.786 Fibonacci zones of the Channel Down (remember it is the dominant pattern throughout the whole year when the correction started).
The short-term strategy is to take one Resistance at a time and target the higher levels only if we get a clear 4H candle closing above the current Resistance at hand. In the same notion, a break above the Channel Down, which is approximately where the 0.382 Fib is, targets the 0.618 level at around 4320. Similarly a closing below the 3750 Support, targets the 0.236 Fibonacci level.
--------------------------------------------------------------------------------------------------------
Please like, subscribe and share your ideas and charts with the community!
--------------------------------------------------------------------------------------------------------

I trade Crypto, Forex, Indices & Commodities on PrimeXBT — all from one account with TradingView charts 👉 tradingshot.short.gy/PrimeXBT
I also use TradeNation for fixed spreads & zero commission 👉 tradingshot.short.gy/Tradenation
I also use TradeNation for fixed spreads & zero commission 👉 tradingshot.short.gy/Tradenation
免責事項
これらの情報および投稿は、TradingViewが提供または承認する金融、投資、取引、またはその他の種類の助言もしくは推奨であることを意図したものではなく、またこれらに該当するものでもありません。詳細は利用規約をご覧ください。
I trade Crypto, Forex, Indices & Commodities on PrimeXBT — all from one account with TradingView charts 👉 tradingshot.short.gy/PrimeXBT
I also use TradeNation for fixed spreads & zero commission 👉 tradingshot.short.gy/Tradenation
I also use TradeNation for fixed spreads & zero commission 👉 tradingshot.short.gy/Tradenation
免責事項
これらの情報および投稿は、TradingViewが提供または承認する金融、投資、取引、またはその他の種類の助言もしくは推奨であることを意図したものではなく、またこれらに該当するものでもありません。詳細は利用規約をご覧ください。