
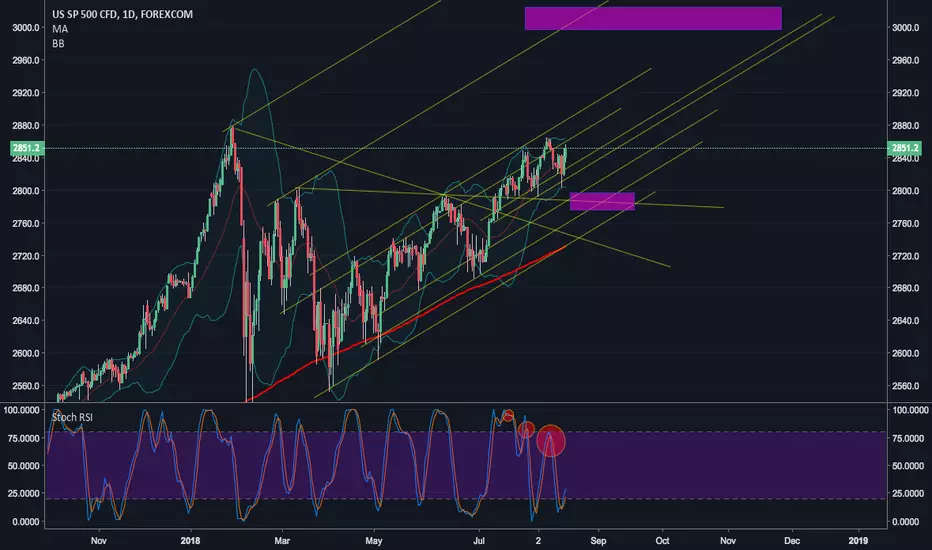
The SP 500 is stair-stepping up parallel support lines, whilst butting up against parallel lines set by March intraday lows. This is technically bullish, and implies that a breakout to the next parallel line is in the cards.
The only concerning point is the successive Stoch RSI bearish divergence. While excessively bullish markets will ignore bearish divergence (and vice versa for bearish markets), the fact that price is close to parallel resistance might suggest that a temporary high could form.
With that said, if a pullback can hold above the breakout line, which is confluence of the parallel lines that have held for the balance of the year, this would be incredibly bullish, and would project a measured move to the 3000 level.
The only concerning point is the successive Stoch RSI bearish divergence. While excessively bullish markets will ignore bearish divergence (and vice versa for bearish markets), the fact that price is close to parallel resistance might suggest that a temporary high could form.
With that said, if a pullback can hold above the breakout line, which is confluence of the parallel lines that have held for the balance of the year, this would be incredibly bullish, and would project a measured move to the 3000 level.

免責事項
これらの情報および投稿は、TradingViewが提供または承認する金融、投資、取引、またはその他の種類の助言もしくは推奨であることを意図したものではなく、またこれらに該当するものでもありません。詳細は利用規約をご覧ください。
免責事項
これらの情報および投稿は、TradingViewが提供または承認する金融、投資、取引、またはその他の種類の助言もしくは推奨であることを意図したものではなく、またこれらに該当するものでもありません。詳細は利用規約をご覧ください。