
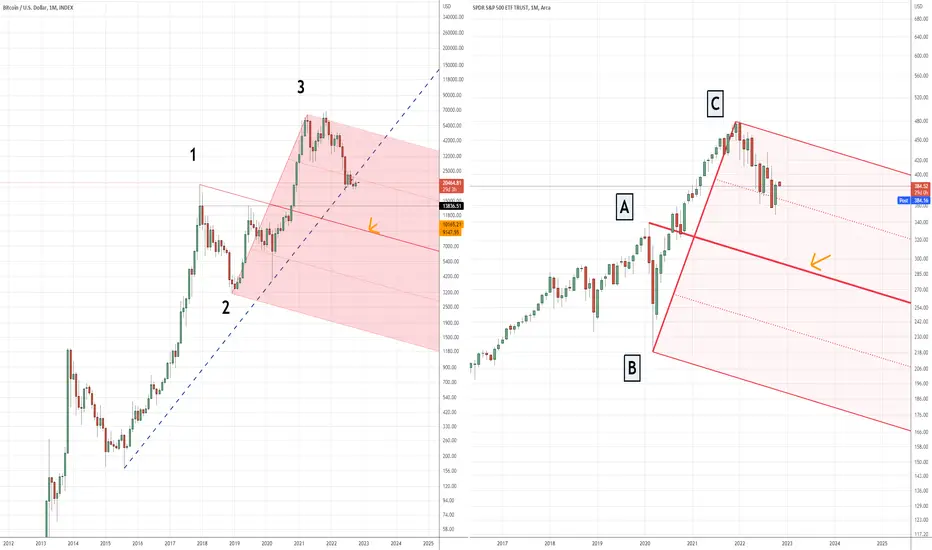
Both in in BTC and SPY charts we have Median Lines that worth a check:
In BTC prices are now under the 50% upside parallel Median Line and the current move could be a pullback of that level, in that case prices could be headed much lower , the Center Line is under 10K right now.
in SPY prices are above the 50% upside parallel but a move back under the 1/2 of the body of the last green candle ( ~373 ) should be seen as an alert to check in case of more downside there to come.
Knowing these patterns may help you have a geometrical map of where price are moving and where could be directed in the future.
No position just sharing the patterns.
In BTC prices are now under the 50% upside parallel Median Line and the current move could be a pullback of that level, in that case prices could be headed much lower , the Center Line is under 10K right now.
in SPY prices are above the 50% upside parallel but a move back under the 1/2 of the body of the last green candle ( ~373 ) should be seen as an alert to check in case of more downside there to come.
Knowing these patterns may help you have a geometrical map of where price are moving and where could be directed in the future.
No position just sharing the patterns.

関連の投稿
免責事項
これらの情報および投稿は、TradingViewが提供または承認する金融、投資、取引、またはその他の種類の助言もしくは推奨であることを意図したものではなく、またこれらに該当するものでもありません。詳細は利用規約をご覧ください。
関連の投稿
免責事項
これらの情報および投稿は、TradingViewが提供または承認する金融、投資、取引、またはその他の種類の助言もしくは推奨であることを意図したものではなく、またこれらに該当するものでもありません。詳細は利用規約をご覧ください。