
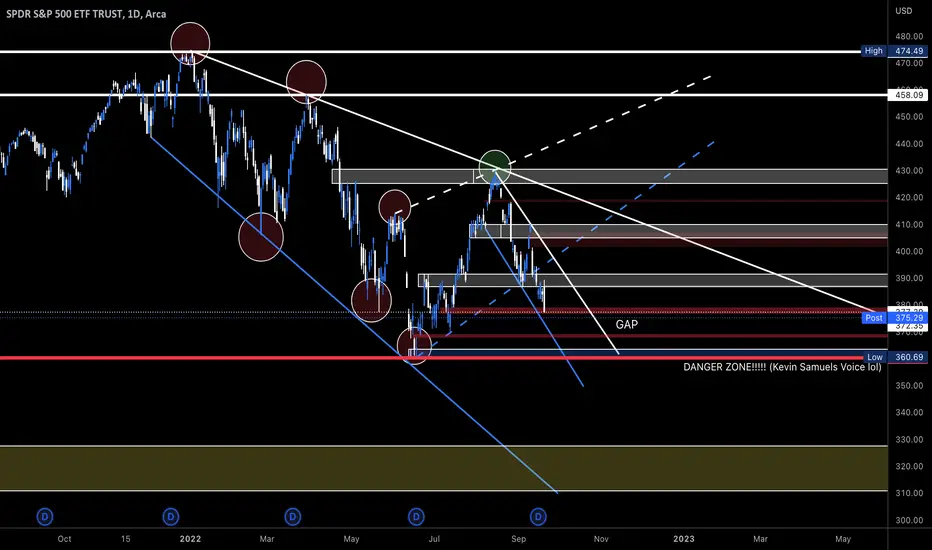
SPY broke below pennant (blue dotted line) and also broke below $386.83 to create a new lower low. It is also trading in a downward flag pattern. SPYs sell off on 9/21/22 after Fed meeting sent the ETF from $389.31 to $377.38. This move filled most of the GAP between $376 - $379, which was created on July 14th/15th. The 9/21 trading day candle on daily timeframe closed “wickless” indicating that there may be more movement lower in the following day (Thursday-9/22/22).
Moving forward, I am watching for a relief bounce from the support line (blue line) in the downward flag pattern that price is currently trading in, followed by a reject (or even possible breakup) from the resistance line (white line) in the downward flag pattern.
Ideally I would want a move down to the June 17th lows of $360.69. Here’s to wishful thinking! And IF SPY happens to break below this point (RED LINE), then let’s just say we’re headed into the DANGER ZONE!! (Kevin Samuels voice lol)
My Golden Zone for a bottom is also indicated in gold between the prices $310 and $327 (Only Speculative!)

Dennis Butler Jr.
免責事項
これらの情報および投稿は、TradingViewが提供または承認する金融、投資、取引、またはその他の種類の助言もしくは推奨であることを意図したものではなく、またこれらに該当するものでもありません。詳細は利用規約をご覧ください。
Dennis Butler Jr.
免責事項
これらの情報および投稿は、TradingViewが提供または承認する金融、投資、取引、またはその他の種類の助言もしくは推奨であることを意図したものではなく、またこれらに該当するものでもありません。詳細は利用規約をご覧ください。