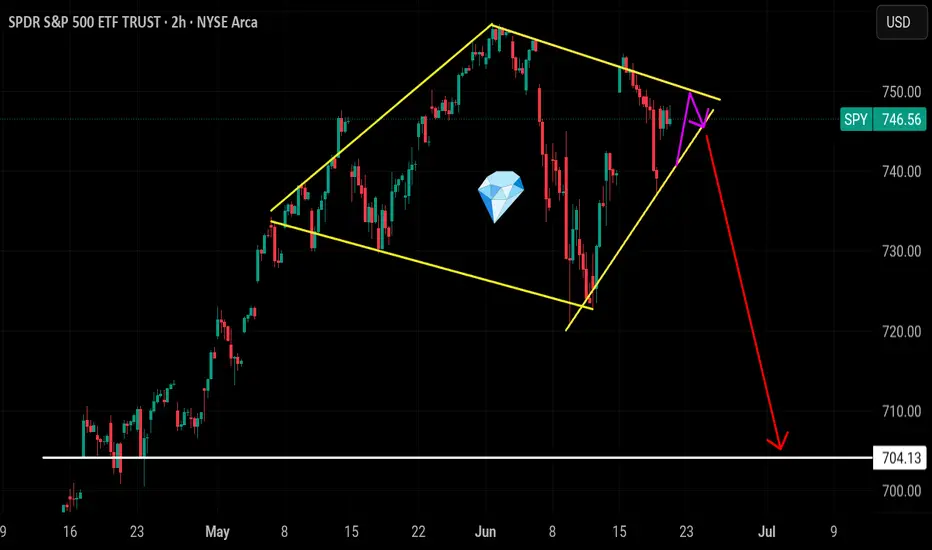
I was looking at  QQQ earlier and I spotted a bearish Diamond top.

Since the SPY is so tech heavy weighted I always prefer to use QQQ or tech for market direction.
Usually when you find technical patterns on Qqq or you'll see similar on spy.
This pattern indicates a range trade inside 740-755 for the next few days
Like so

And around Wed-Thurs we could see a possible breakdown.. this is all technical analysis but coincidentally The monthly Core PCE and GDP comes out Thursday . If I'm right and this diamond plays out then 705-710 comes from this move

If I'm wrong, then spy breaks and close above 755
Then 780 is incoming

The DJI just printed a weekly bearish shooting star.

Daily chart at resistance

Here's the chip sector SMH
SMH
1hr chart

Rising wedge.. of the 1hr candle is correct and trendline resistance holds then we should see red early in the week on chips but the sell won't come until late in the week when this wedge breaks..
1 sector finished really bearish and that's the banking sector $XLF. Xlf finished with a weekly bearish reversal here at 55.00 resistance and outside bbands

Lastly IGV which is the software sector responsible for
  MSFT
MSFT  ORCL and
  PLTR finish with weekly 3 black crows . This bearish pattern indicates a 4 week of red is highly probable

Im not just focusing on the small price action like the hourly, even when zoom out back to the 2009 housing crash spy has only broken this trendline once with the stimulus inject of covid

And when you zoom in you can
Where the diamond is positioned

Log scale or logarithmic
QQQ earlier and I spotted a bearish Diamond top.Since the
SPY is so tech heavy weighted I always prefer to use QQQ or tech for market direction.Usually when you find technical patterns on Qqq or you'll see similar on spy.
This pattern indicates a range trade inside 740-755 for the next few days
Like so
And around Wed-Thurs we could see a possible breakdown.. this is all technical analysis but coincidentally The monthly Core PCE and GDP comes out Thursday . If I'm right and this diamond plays out then 705-710 comes from this move
If I'm wrong, then spy breaks and close above 755
Then 780 is incoming
The
DJI just printed a weekly bearish shooting star.Daily chart at resistance
Here's the chip sector
SMH1hr chart
Rising wedge.. of the 1hr candle is correct and trendline resistance holds then we should see red early in the week on chips but the sell won't come until late in the week when this wedge breaks..
1 sector finished really bearish and that's the banking sector $XLF. Xlf finished with a weekly bearish reversal here at 55.00 resistance and outside bbands
Lastly
IGV which is the software sector responsible for MSFT ORCL and PLTR finish with weekly 3 black crows . This bearish pattern indicates a 4 week of red is highly probable Im not just focusing on the small price action like the hourly, even when zoom out back to the 2009 housing crash spy has only broken this trendline once with the stimulus inject of covid
And when you zoom in you can
Where the diamond is positioned
Log scale or logarithmic

免責事項
これらの情報および投稿は、TradingViewが提供または承認する金融、投資、取引、またはその他の種類の助言もしくは推奨であることを意図したものではなく、またこれらに該当するものでもありません。詳細は利用規約をご覧ください。
免責事項
これらの情報および投稿は、TradingViewが提供または承認する金融、投資、取引、またはその他の種類の助言もしくは推奨であることを意図したものではなく、またこれらに該当するものでもありません。詳細は利用規約をご覧ください。