
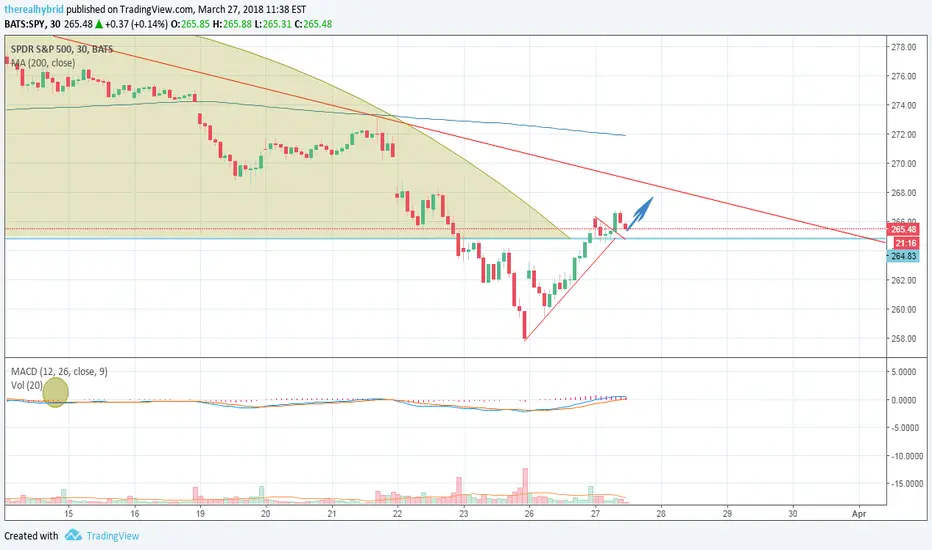
Welcome traders!! Continuing from the break of yesterday's resistance at the 264.74 area, we can see in the 30 min chart that we've now had a clean bounce off of that same level meaning we should expect to continue seeing upward movement hopefully breaking through the upper descending triangle. On our 4 hour chart the MACD looks to be going for a bullish crossover which is looking good and some are starting to show, like BBY & AAPL, but keep in mind we still have yet to test that resistance level up top. This is an analysis of what "I" see in these charts, so take it as you wish, as always good luck and safe trading!

免責事項
これらの情報および投稿は、TradingViewが提供または承認する金融、投資、取引、またはその他の種類の助言もしくは推奨であることを意図したものではなく、またこれらに該当するものでもありません。詳細は利用規約をご覧ください。
免責事項
これらの情報および投稿は、TradingViewが提供または承認する金融、投資、取引、またはその他の種類の助言もしくは推奨であることを意図したものではなく、またこれらに該当するものでもありません。詳細は利用規約をご覧ください。