
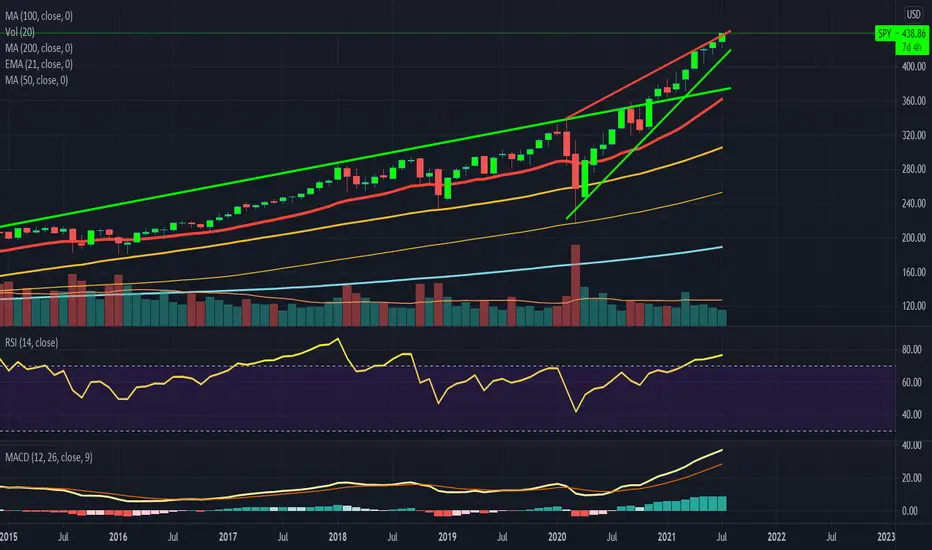
SPY monthly RSI is 76.75. Remember the RSI pattern we discussed recently? Look at the RSI from Jan 2019 to Feb 2020, and then look at the RSI from Feb 2020 to Jul 2021. That's an almost identical impulse wave. What comes next, if history is any indication, is a massive, unexpected, market crash. We'll have to wait and see how the wave plays out...

関連の投稿
免責事項
これらの情報および投稿は、TradingViewが提供または承認する金融、投資、取引、またはその他の種類の助言もしくは推奨であることを意図したものではなく、またこれらに該当するものでもありません。詳細は利用規約をご覧ください。
関連の投稿
免責事項
これらの情報および投稿は、TradingViewが提供または承認する金融、投資、取引、またはその他の種類の助言もしくは推奨であることを意図したものではなく、またこれらに該当するものでもありません。詳細は利用規約をご覧ください。