
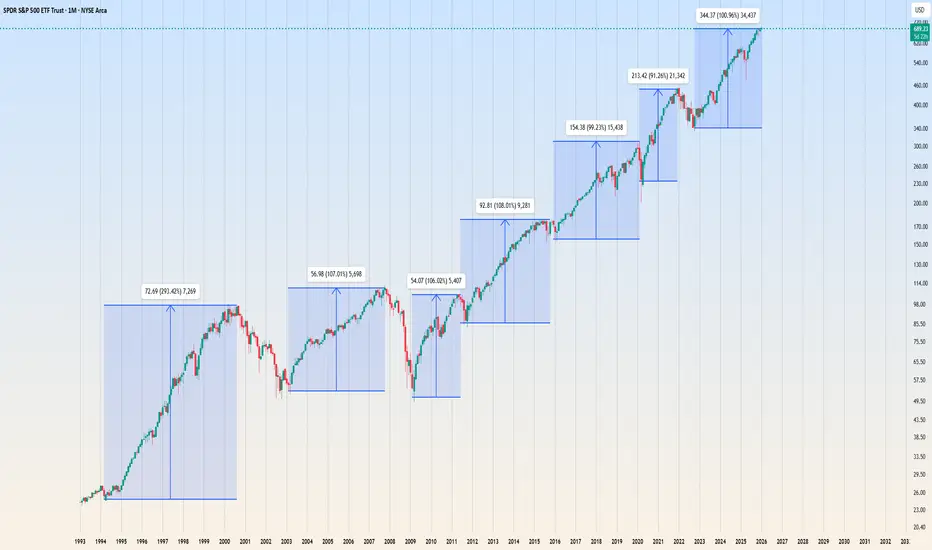
SP500 has a just about completing 100% cycle as seen from the chart. This can be seen as an additional conformation to other technicals. You can go back to 1950's and verify that markets have corrected, consolidate,crashed after this psychological number, multiple times. If its not 100% then it can be a multiple of 100% like the 2000 bull run was for very close to 300%

免責事項
これらの情報および投稿は、TradingViewが提供または承認する金融、投資、取引、またはその他の種類の助言もしくは推奨であることを意図したものではなく、またこれらに該当するものでもありません。詳細は利用規約をご覧ください。
免責事項
これらの情報および投稿は、TradingViewが提供または承認する金融、投資、取引、またはその他の種類の助言もしくは推奨であることを意図したものではなく、またこれらに該当するものでもありません。詳細は利用規約をご覧ください。