
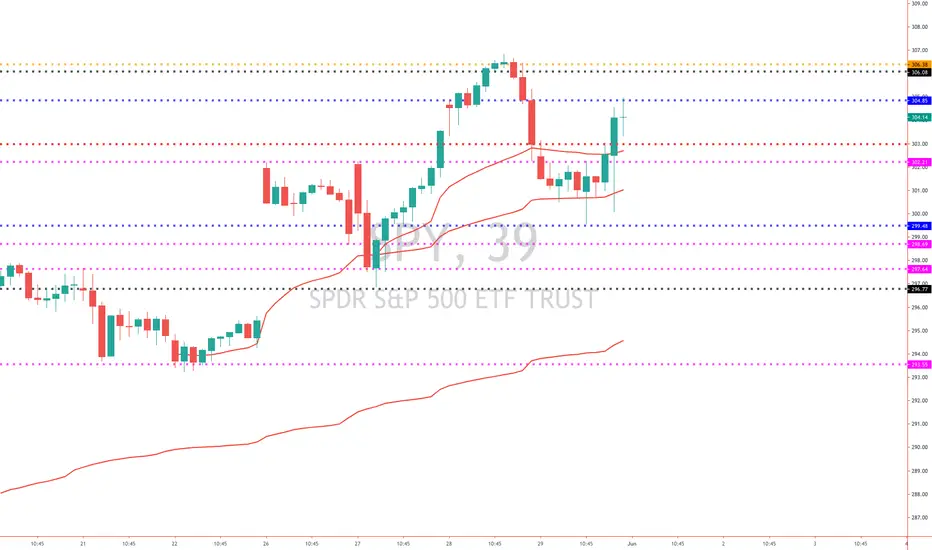
Spy Levels for the week .
Anchor Vwap to see potential key support
Anchor Vwap to see potential key support
ノート
Black lines - represent last week high and lowBlue lines - respresent previous day high and low
purple line- represents supports and resistance
yellow lines- represents last month high and low
Red indicator represents anchor vwap from previous lows and high. this also works as potential support to watch

免責事項
これらの情報および投稿は、TradingViewが提供または承認する金融、投資、取引、またはその他の種類の助言もしくは推奨であることを意図したものではなく、またこれらに該当するものでもありません。詳細は利用規約をご覧ください。
免責事項
これらの情報および投稿は、TradingViewが提供または承認する金融、投資、取引、またはその他の種類の助言もしくは推奨であることを意図したものではなく、またこれらに該当するものでもありません。詳細は利用規約をご覧ください。