
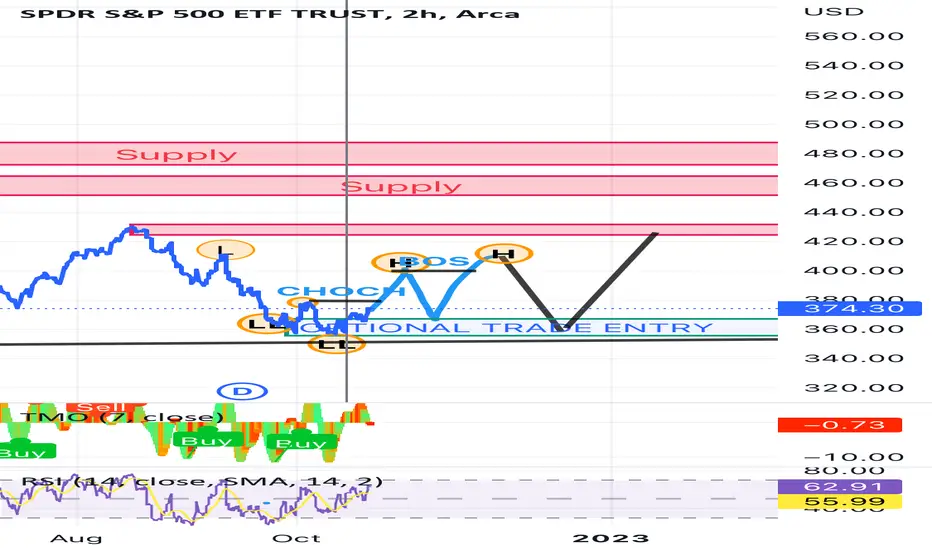
In this chart we can see some pattern that fits to this strategy.
We saw a lot of liquidity in the path few months.
And sometimes the market can give u some bouncy bull trend for a couple of days or even week or two.
In this chart , u can see some pattern that give us some indication that may be some poll up , and then it going down to check the LL prices
And after that we can hope.

免責事項
これらの情報および投稿は、TradingViewが提供または承認する金融、投資、取引、またはその他の種類の助言もしくは推奨であることを意図したものではなく、またこれらに該当するものでもありません。詳細は利用規約をご覧ください。
免責事項
これらの情報および投稿は、TradingViewが提供または承認する金融、投資、取引、またはその他の種類の助言もしくは推奨であることを意図したものではなく、またこれらに該当するものでもありません。詳細は利用規約をご覧ください。