
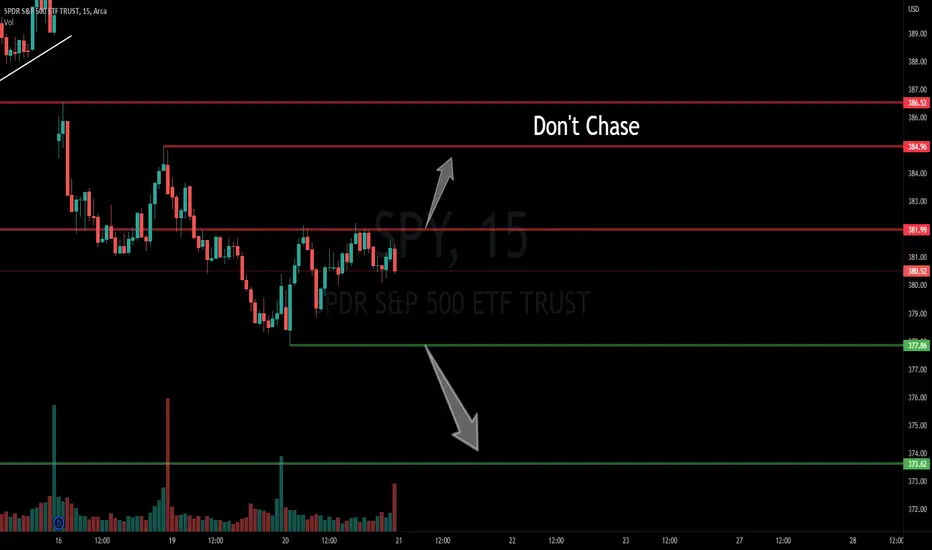
Yea, so basically these are my supply and demand levels on a shorter time frame, I graphed these on 15-30 minute time frames. What I usually do is I see whatever level we break in the market, if we fully close above with not a lot of opposing pressure, we can take calls or puts respectively. I also take calls and puts off the rejection of these because I look to see if the candle is being rejected or being pushed up/down into the next zone through pressure. This is a very bad explanation but take from it what you will. Enjoy, and Good Trading Lads!

免責事項
これらの情報および投稿は、TradingViewが提供または承認する金融、投資、取引、またはその他の種類の助言もしくは推奨であることを意図したものではなく、またこれらに該当するものでもありません。詳細は利用規約をご覧ください。
免責事項
これらの情報および投稿は、TradingViewが提供または承認する金融、投資、取引、またはその他の種類の助言もしくは推奨であることを意図したものではなく、またこれらに該当するものでもありません。詳細は利用規約をご覧ください。