
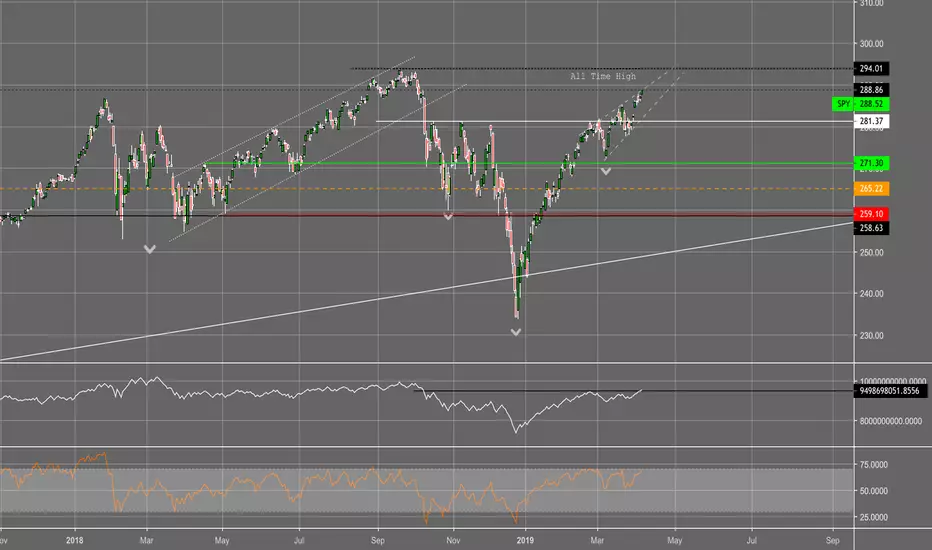
Strong rising wedge for the S&P. Could this take a healthy fall back down...RSI implies it is overbought
Also we had a parabolic move up from the lows of December/Jan...with no real healthy moves down for a recovery period on the way back up
Hypothesis: price reaches near ATH to fail at resistant levels. If it price proves to move back down, I think it could make a W shaped pattern before a move back up or complete a right shoulder for a inverse head and shoulders pattern.
Also we had a parabolic move up from the lows of December/Jan...with no real healthy moves down for a recovery period on the way back up
Hypothesis: price reaches near ATH to fail at resistant levels. If it price proves to move back down, I think it could make a W shaped pattern before a move back up or complete a right shoulder for a inverse head and shoulders pattern.
トレード稼働中
The S&P has now fallen out of the rising wedge and has accomplished target 1
免責事項
これらの情報および投稿は、TradingViewが提供または承認する金融、投資、取引、またはその他の種類の助言もしくは推奨であることを意図したものではなく、またこれらに該当するものでもありません。詳細は利用規約をご覧ください。
免責事項
これらの情報および投稿は、TradingViewが提供または承認する金融、投資、取引、またはその他の種類の助言もしくは推奨であることを意図したものではなく、またこれらに該当するものでもありません。詳細は利用規約をご覧ください。