
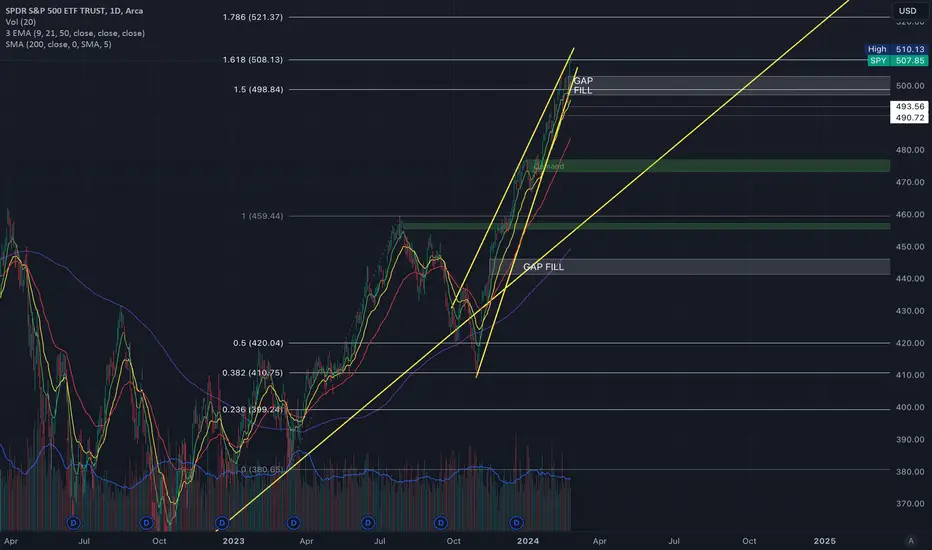
The Daily chart showed that price started below the 9EMA for this week and gapped up above the 9EMA on Thursday and closed the week well above it. Gap fill is at 497.37 and Support is at 503.50 which was a previous daily high. There is a Double Bearish Divergence on the RSI from a high of 74.77 to 72.56 and closed the week on a bearish candle that closed +0.07% with a 68.53 RSI.
Based on a Fibonacci Retracement (380.65 -> 459.44 bounced off the 0.382 Fib at 410.75) and Extension (2.0 at 538.23), if price holds 508.13 (1.618) it can run to 521.37 (1.786).
Based on a Fibonacci Retracement (380.65 -> 459.44 bounced off the 0.382 Fib at 410.75) and Extension (2.0 at 538.23), if price holds 508.13 (1.618) it can run to 521.37 (1.786).

免責事項
これらの情報および投稿は、TradingViewが提供または承認する金融、投資、取引、またはその他の種類の助言もしくは推奨であることを意図したものではなく、またこれらに該当するものでもありません。詳細は利用規約をご覧ください。
免責事項
これらの情報および投稿は、TradingViewが提供または承認する金融、投資、取引、またはその他の種類の助言もしくは推奨であることを意図したものではなく、またこれらに該当するものでもありません。詳細は利用規約をご覧ください。