
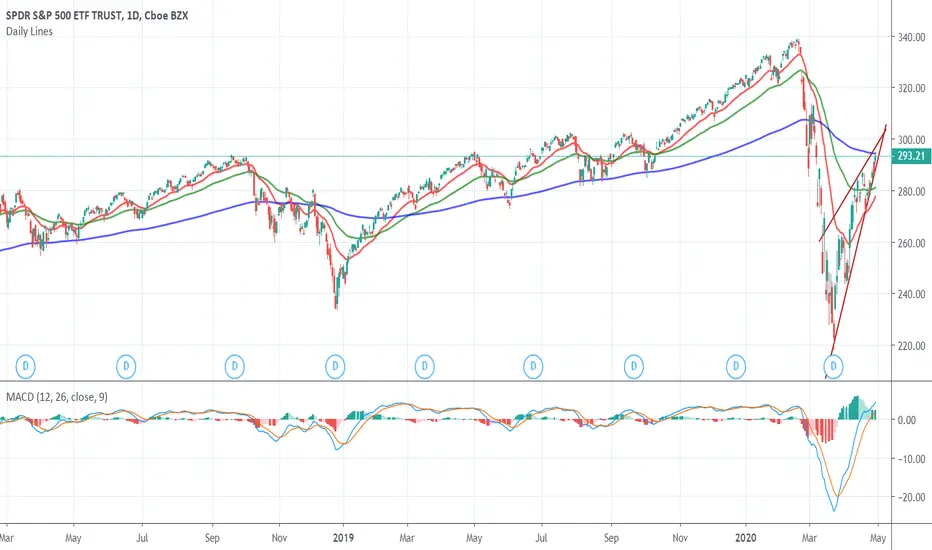
SPY ETF (S&P500) has reached its 200 EMA at $294 (purple line). This is a significant level, as it may serve as resistance. If we break through $300, then the market may continue going up to $340. 50 day EMA (red) is close to crossing 100 day EMA (green) from below, pointing toward higher prices. MACD chart is near the top, but is still pointing upward. Based on technicals, the rally may continue. Caution may be a good approach to taking long exposure, as traders are selling into these rallies. The fundamentals remain bearish.

免責事項
これらの情報および投稿は、TradingViewが提供または承認する金融、投資、取引、またはその他の種類の助言もしくは推奨であることを意図したものではなく、またこれらに該当するものでもありません。詳細は利用規約をご覧ください。
免責事項
これらの情報および投稿は、TradingViewが提供または承認する金融、投資、取引、またはその他の種類の助言もしくは推奨であることを意図したものではなく、またこれらに該当するものでもありません。詳細は利用規約をご覧ください。