
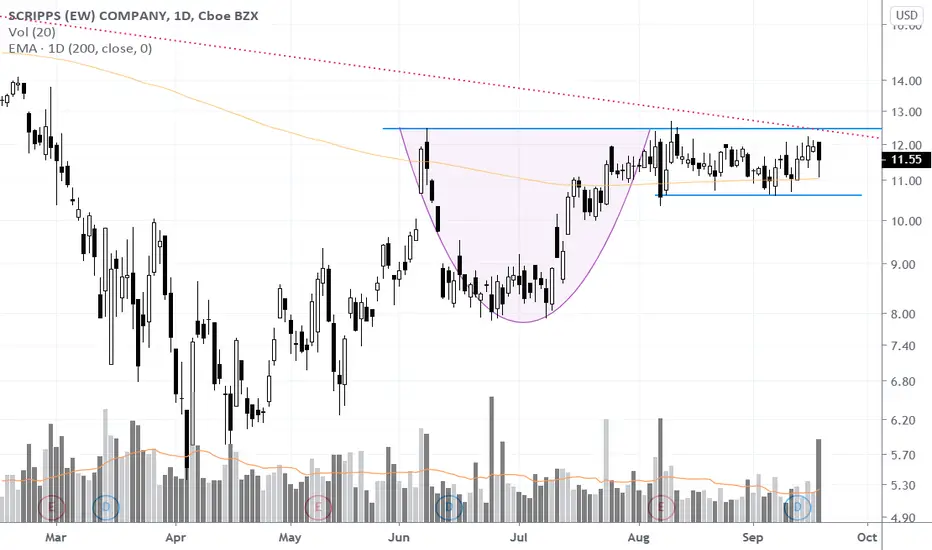
The handle part of the pattern is taking on the shape of 2 month rectangle pattern with $12.50 acting as boundary resistance. Chart patterns that accomplishes 3 things when they breakout are ones that have the most chance succeeding. When the breakout takes place (daily close above $12.50), SSP will:
1) Close above its cup and handle chart pattern (blue line on chart - breakout)
2) Clear a multi month weekly downtrend (red trend line on chart)
3) Clear/Breakaway from the 200 MA (yellow line on the chart)
1) Close above its cup and handle chart pattern (blue line on chart - breakout)
2) Clear a multi month weekly downtrend (red trend line on chart)
3) Clear/Breakaway from the 200 MA (yellow line on the chart)
注文をキャンセル
volatile day on September 24th. never closed over chart pattern resistance. Chart is too all over the place. removing from watch list.
✔ Momentum & Breakout Trader Since 2006 | Influenced by Mark Minervini VCP Trading Style & William O'Neil CANSLIM 📈
✔ Follow me on Twitter @taplot - twitter.com/TaPlot
✔ YouTube channel youtube.com/@taplot
✔ Follow me on Twitter @taplot - twitter.com/TaPlot
✔ YouTube channel youtube.com/@taplot
免責事項
これらの情報および投稿は、TradingViewが提供または承認する金融、投資、取引、またはその他の種類の助言もしくは推奨であることを意図したものではなく、またこれらに該当するものでもありません。詳細は利用規約をご覧ください。
✔ Momentum & Breakout Trader Since 2006 | Influenced by Mark Minervini VCP Trading Style & William O'Neil CANSLIM 📈
✔ Follow me on Twitter @taplot - twitter.com/TaPlot
✔ YouTube channel youtube.com/@taplot
✔ Follow me on Twitter @taplot - twitter.com/TaPlot
✔ YouTube channel youtube.com/@taplot
免責事項
これらの情報および投稿は、TradingViewが提供または承認する金融、投資、取引、またはその他の種類の助言もしくは推奨であることを意図したものではなく、またこれらに該当するものでもありません。詳細は利用規約をご覧ください。