
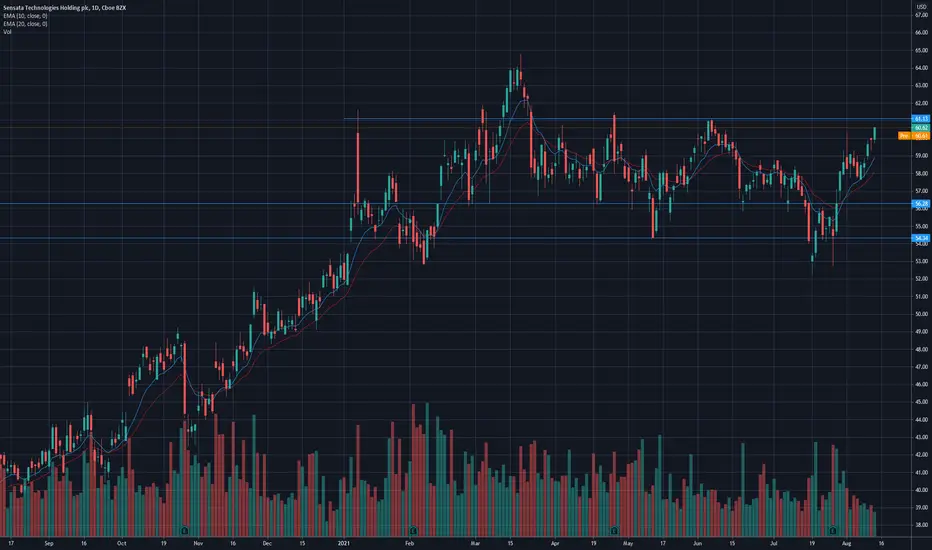
After using the highs from 2015 and 2018 ($56.28) as support, ST is now approaching the resistance of $61.13. Also note that ST has been ranging from year-to-date between $56.28 and $61.13.
Judging from the price action, it seems like ST may break and close above $61.13 in the coming week.
A rejection from $61.13 could have ST test the support of $59.90
Look for buying opportunities:
* Around the $59.90 area
OR
* After a daily close above $61.13
Judging from the price action, it seems like ST may break and close above $61.13 in the coming week.
A rejection from $61.13 could have ST test the support of $59.90
Look for buying opportunities:
* Around the $59.90 area
OR
* After a daily close above $61.13

免責事項
これらの情報および投稿は、TradingViewが提供または承認する金融、投資、取引、またはその他の種類の助言もしくは推奨であることを意図したものではなく、またこれらに該当するものでもありません。詳細は利用規約をご覧ください。
免責事項
これらの情報および投稿は、TradingViewが提供または承認する金融、投資、取引、またはその他の種類の助言もしくは推奨であることを意図したものではなく、またこれらに該当するものでもありません。詳細は利用規約をご覧ください。