更新済
Possible Ascending Triangle Forming
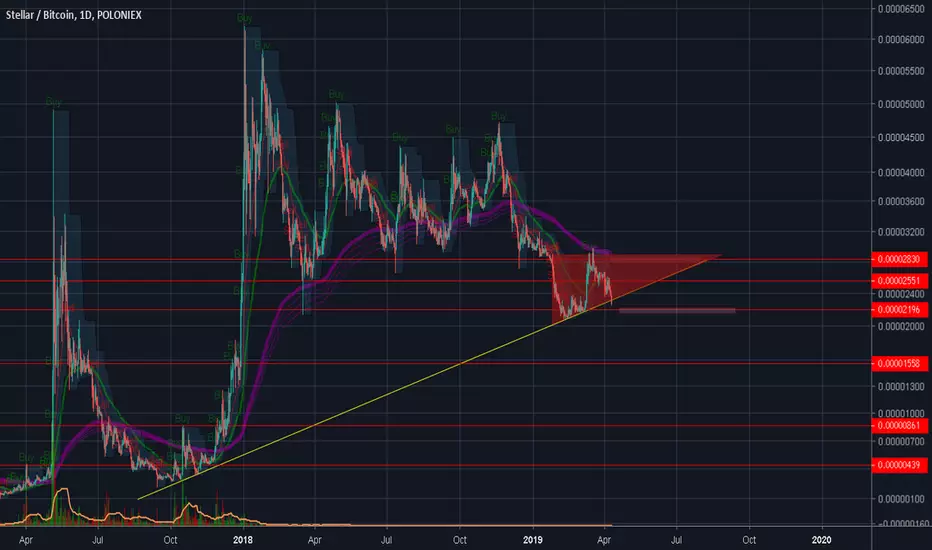
After being rejected from 200 EMA and now currently Testing trendline that already been established since October 2017.
it's a crucial support in order to maintain the price level above 2200 satoshi if it broke.. expect a major downfall since there's few support in play from the past time...
if we look closely we also inside the Ascending triangle, if the recent price action manage to bounce back within triangle. although it known as bullish pattern. it will be interesting how it's will plays out because ascending triangle also can failed and play to be a continuation for a bear trend to keep maintained. expect a volatility in this coin soon.

Support :
2200 satoshi
1560 satoshi
Resistance
+- 2550 satoshi
+- 2800 satoshi 200 EMA area.
it's a crucial support in order to maintain the price level above 2200 satoshi if it broke.. expect a major downfall since there's few support in play from the past time...
if we look closely we also inside the Ascending triangle, if the recent price action manage to bounce back within triangle. although it known as bullish pattern. it will be interesting how it's will plays out because ascending triangle also can failed and play to be a continuation for a bear trend to keep maintained. expect a volatility in this coin soon.
Support :
2200 satoshi
1560 satoshi
Resistance
+- 2550 satoshi
+- 2800 satoshi 200 EMA area.
ノート
well... turn's out it's a continuation pattern for bear trend...
免責事項
これらの情報および投稿は、TradingViewが提供または承認する金融、投資、取引、またはその他の種類の助言もしくは推奨であることを意図したものではなく、またこれらに該当するものでもありません。詳細は利用規約をご覧ください。
免責事項
これらの情報および投稿は、TradingViewが提供または承認する金融、投資、取引、またはその他の種類の助言もしくは推奨であることを意図したものではなく、またこれらに該当するものでもありません。詳細は利用規約をご覧ください。