ロング
STRTECH SWING ANALYSIS
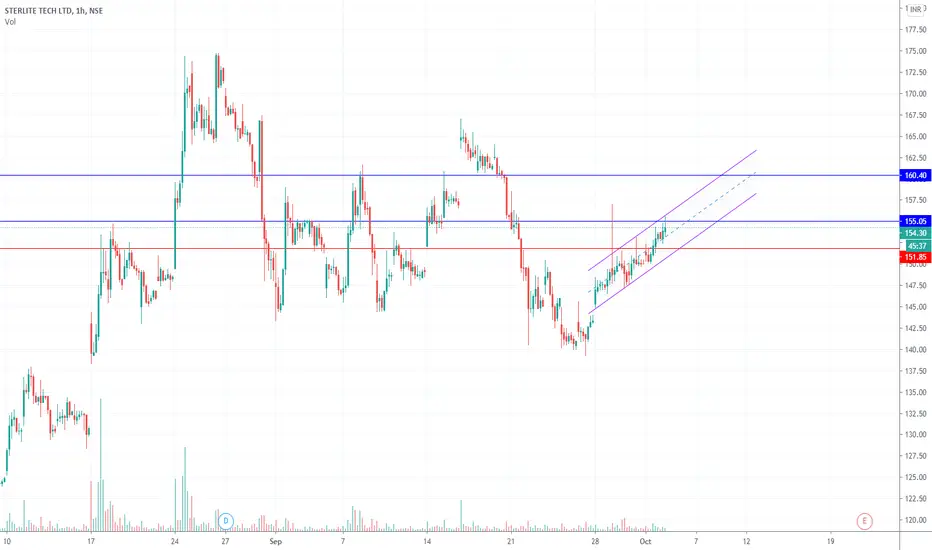
As per the Technical Analysis Chart Pattern, STRTECH Swing view.
The potential bullish trend with the upside of 160 as the target from the breakout of 155. We can follow the strict Stop Loss of 152. It is only Buy Above the resistance of level of 155.
Traders, If you liked this idea, hit the like button and write in the comment section.
This is only for educational purposes.
The potential bullish trend with the upside of 160 as the target from the breakout of 155. We can follow the strict Stop Loss of 152. It is only Buy Above the resistance of level of 155.
Traders, If you liked this idea, hit the like button and write in the comment section.
This is only for educational purposes.

免責事項
これらの情報および投稿は、TradingViewが提供または承認する金融、投資、取引、またはその他の種類の助言もしくは推奨であることを意図したものではなく、またこれらに該当するものでもありません。詳細は利用規約をご覧ください。
免責事項
これらの情報および投稿は、TradingViewが提供または承認する金融、投資、取引、またはその他の種類の助言もしくは推奨であることを意図したものではなく、またこれらに該当するものでもありません。詳細は利用規約をご覧ください。