
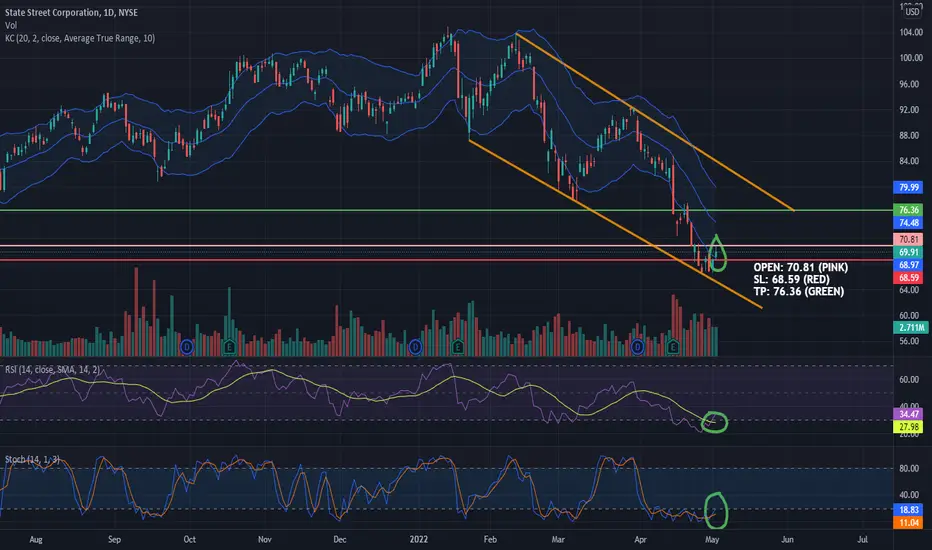
As we can see in this graph, STT stock seems to be following a bearish pattern (orange lines). It just hit the and bounced on the bottom line, so we can take advantage of the movement with a long position. Starting from the bottom, in green we highlighted 3 signals:
-STOCHASTIC: even if it still is in the oversold area, we can see that the signal line has just been crossed upward;
-RSI just crossed the signal line and left the oversold area, giving us a pretty strong long signal;
-KELTNER CHANNEL: as we can see, the price rose above KC's bottom line giving us another buy signal.
Even MACD encourages us to go long because it is gaining bullish strength and it is close to crossing the signal line.
Fundamentals;
Earning were released just two weeks ago with better results than expected.
LONG
OPEN: 70.81
SL: 68.59
TP: 76.36
We could also aim higher than TP, until top orange line.
-STOCHASTIC: even if it still is in the oversold area, we can see that the signal line has just been crossed upward;
-RSI just crossed the signal line and left the oversold area, giving us a pretty strong long signal;
-KELTNER CHANNEL: as we can see, the price rose above KC's bottom line giving us another buy signal.
Even MACD encourages us to go long because it is gaining bullish strength and it is close to crossing the signal line.
Fundamentals;
Earning were released just two weeks ago with better results than expected.
LONG
OPEN: 70.81
SL: 68.59
TP: 76.36
We could also aim higher than TP, until top orange line.

💥 Free signals and ideas ➡ t.me/vfinvestment
免責事項
これらの情報および投稿は、TradingViewが提供または承認する金融、投資、取引、またはその他の種類の助言もしくは推奨であることを意図したものではなく、またこれらに該当するものでもありません。詳細は利用規約をご覧ください。
💥 Free signals and ideas ➡ t.me/vfinvestment
免責事項
これらの情報および投稿は、TradingViewが提供または承認する金融、投資、取引、またはその他の種類の助言もしくは推奨であることを意図したものではなく、またこれらに該当するものでもありません。詳細は利用規約をご覧ください。