
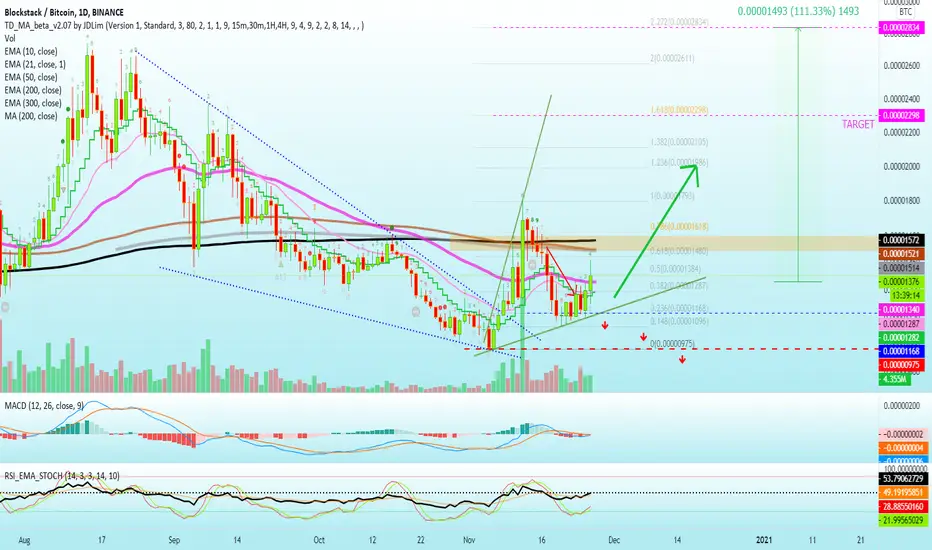
STXBTC (Blockstack) moved up recently and challenged MA200, the black line on the chart.
A rejection happened at this level which ended in a higher low... We are now seeing its price recover, there can be additional growth.
STXBTC Chart Signals
The chart looks pretty healthy...
There can be additional growth.
Additional information, including targets and support levels, can be found on the chart.
Thanks a lot for reading.
Namaste.
A rejection happened at this level which ended in a higher low... We are now seeing its price recover, there can be additional growth.
STXBTC Chart Signals
- Here we have prices moving above EMA10, EMA21, and EMA50.
- The RSI is strong at 52.
- The MACD is above zero (bullish).
The chart looks pretty healthy...
There can be additional growth.
Additional information, including targets and support levels, can be found on the chart.
Thanks a lot for reading.
Namaste.

✅ Cryptocurrencies technical analysis & results
t.me/masteranandatrades/9279
✅ Stocks technical analysis
t.me/anandastocks
✅ PREMIUM · Enjoyed the content?
t.me/lamatrades/4 (🔝 since 2017)
t.me/masteranandatrades/9279
✅ Stocks technical analysis
t.me/anandastocks
✅ PREMIUM · Enjoyed the content?
t.me/lamatrades/4 (🔝 since 2017)
関連の投稿
免責事項
これらの情報および投稿は、TradingViewが提供または承認する金融、投資、取引、またはその他の種類の助言もしくは推奨であることを意図したものではなく、またこれらに該当するものでもありません。詳細は利用規約をご覧ください。
✅ Cryptocurrencies technical analysis & results
t.me/masteranandatrades/9279
✅ Stocks technical analysis
t.me/anandastocks
✅ PREMIUM · Enjoyed the content?
t.me/lamatrades/4 (🔝 since 2017)
t.me/masteranandatrades/9279
✅ Stocks technical analysis
t.me/anandastocks
✅ PREMIUM · Enjoyed the content?
t.me/lamatrades/4 (🔝 since 2017)
関連の投稿
免責事項
これらの情報および投稿は、TradingViewが提供または承認する金融、投資、取引、またはその他の種類の助言もしくは推奨であることを意図したものではなく、またこれらに該当するものでもありません。詳細は利用規約をご覧ください。