
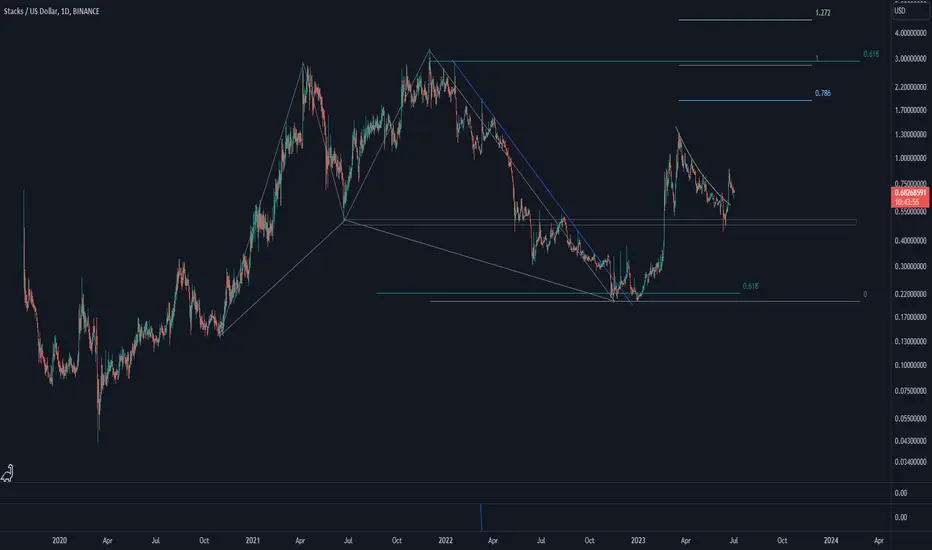
Stacks started its upward impulse wave sooner than others. Back when a harmonic pattern ended and price settled on 0.618 Fibonacci level, STX started a strong upward wave. After a 500% growth, corrective wave started. Now it seems STX posed for continuation. Let's see what happens.
ノート
STX is breaking the second curved downtrend line. Let's see how up it can go.
ノート
STX broke the descending triangle correction pattern is going up.
ノート
STX broke the major downtrend line, and broke it with momentum. This behavior could be sign of powerful upward impulse wave indicating that STX could see much higher price. Let's see what happens.
ノート
After STX broke the major downtrend line, it went up, and still going. Now, STX is approaching the intersection of the major horizontal area and the possible ascending channel's upper line. Let's see how STX reacts to these areas.
ノート
So, STX went up very well and reached both the ascending channel's upper line and major horizontal resistance area. Unless important news about STX cause to burst through this area upward, correction is most likely to happen. Let's see what happens.
ノート
So, correction brought STX down to the channel's middle line. Let's see if STX's correction ends here and an upward move starts or not.
ノート
So, STX went down to the channel's lower line. Recently, STX broke the downtrend line, and it seems ready for the next upward phase. Let's see what happens.

免責事項
これらの情報および投稿は、TradingViewが提供または承認する金融、投資、取引、またはその他の種類の助言もしくは推奨であることを意図したものではなく、またこれらに該当するものでもありません。詳細は利用規約をご覧ください。
免責事項
これらの情報および投稿は、TradingViewが提供または承認する金融、投資、取引、またはその他の種類の助言もしくは推奨であることを意図したものではなく、またこれらに該当するものでもありません。詳細は利用規約をご覧ください。