
Daily Consolidation at Key Fibonacci Support Zone [Educational]
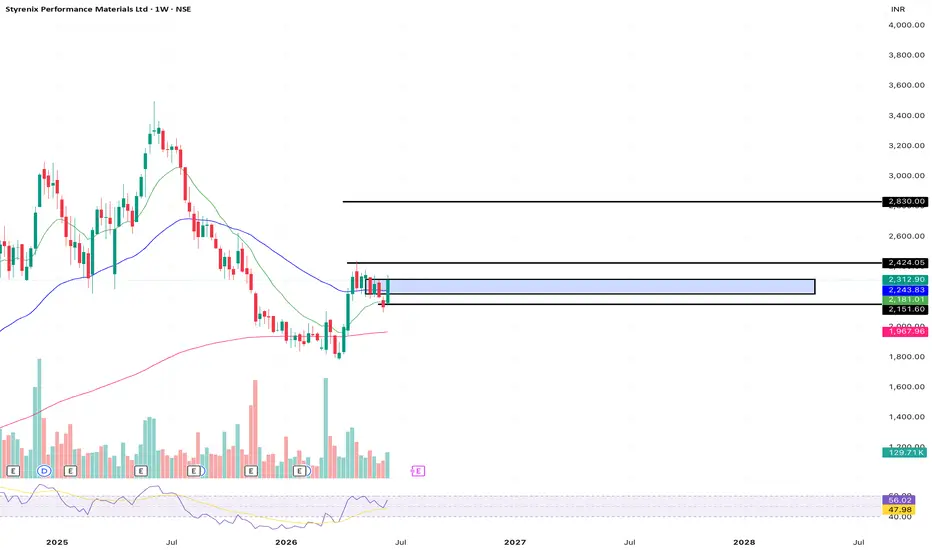
📊 Styrenix Performance Materials Ltd (STYRENIX) - Daily (1D) Chart Analysis
This post is shared for EDUCATIONAL PURPOSES ONLY to analyze daily Fibonacci structures and moving average setups. It is not financial or investment advice.
🟢 Technical Observations:
1. Reclaimed Support Floor: On the daily timeframe, STYRENIX has established strong baseline support at the 50.00% Fibonacci level (2,095.50).
2. Moving Average Crossover: The short-term moving averages (blue and red lines) have compressed and are beginning to curl upward underneath the current price of 2,312.90, signaling a potential shift in short-term momentum.
3. Consolidation Zone: The price is currently tightly consolidating between the 50% Fib support (2,095.50) and the immediate overhead 38.2% Fib resistance (2,424.10). A daily close above 2,424.10 could trigger an aggressive breakout move.
🎯 Educational Swing Setup (Daily View):
• Entry Zone: 2,220.00 – 2,315.00 (Accumulating within this consolidation pocket provides a tight, low-risk entry relative to the recent swing low).
• Target 1: 2,424.00 (Immediate 38.2% Fibonacci Retracement barrier)
• Target 2: 2,830.00 (23.6% Fibonacci level / previous major structural peak)
• Invalidation / Stop-Loss: 2,150.00 (A daily close below the moving average cluster and the 50% Fib level invalidates this immediate reversal setup).
• Expected Duration: 5 to 15 Trading Days (Short-to-medium daily swing)
⚠️ Risk Management:
Keep a close eye on the daily volume. An expansion of green volume bars will confirm if institutional buyers are stepping in to break past the 2,424 resistance level. Always size your positions appropriately!
This post is shared for EDUCATIONAL PURPOSES ONLY to analyze daily Fibonacci structures and moving average setups. It is not financial or investment advice.
🟢 Technical Observations:
1. Reclaimed Support Floor: On the daily timeframe, STYRENIX has established strong baseline support at the 50.00% Fibonacci level (2,095.50).
2. Moving Average Crossover: The short-term moving averages (blue and red lines) have compressed and are beginning to curl upward underneath the current price of 2,312.90, signaling a potential shift in short-term momentum.
3. Consolidation Zone: The price is currently tightly consolidating between the 50% Fib support (2,095.50) and the immediate overhead 38.2% Fib resistance (2,424.10). A daily close above 2,424.10 could trigger an aggressive breakout move.
🎯 Educational Swing Setup (Daily View):
• Entry Zone: 2,220.00 – 2,315.00 (Accumulating within this consolidation pocket provides a tight, low-risk entry relative to the recent swing low).
• Target 1: 2,424.00 (Immediate 38.2% Fibonacci Retracement barrier)
• Target 2: 2,830.00 (23.6% Fibonacci level / previous major structural peak)
• Invalidation / Stop-Loss: 2,150.00 (A daily close below the moving average cluster and the 50% Fib level invalidates this immediate reversal setup).
• Expected Duration: 5 to 15 Trading Days (Short-to-medium daily swing)
⚠️ Risk Management:
Keep a close eye on the daily volume. An expansion of green volume bars will confirm if institutional buyers are stepping in to break past the 2,424 resistance level. Always size your positions appropriately!
トレード稼働中
T1 done in 31 days 
免責事項
これらの情報および投稿は、TradingViewが提供または承認する金融、投資、取引、またはその他の種類の助言もしくは推奨であることを意図したものではなく、またこれらに該当するものでもありません。詳細は利用規約をご覧ください。
免責事項
これらの情報および投稿は、TradingViewが提供または承認する金融、投資、取引、またはその他の種類の助言もしくは推奨であることを意図したものではなく、またこれらに該当するものでもありません。詳細は利用規約をご覧ください。