
SUI: Tight Weekly Compression – All-Time High Breakout Scenario Based on Historical Cycles
SUI is entering a highly pivotal technical compression phase on the weekly timeframe, carving out a compelling macro trading opportunity. The current price action is moving sideways within an extremely tight volatility range. In market structure theory, this persistent consolidation indicates that selling pressure is completely exhausted, allowing institutional liquidity to quietly accumulate positions in preparation for the next expansion phase.
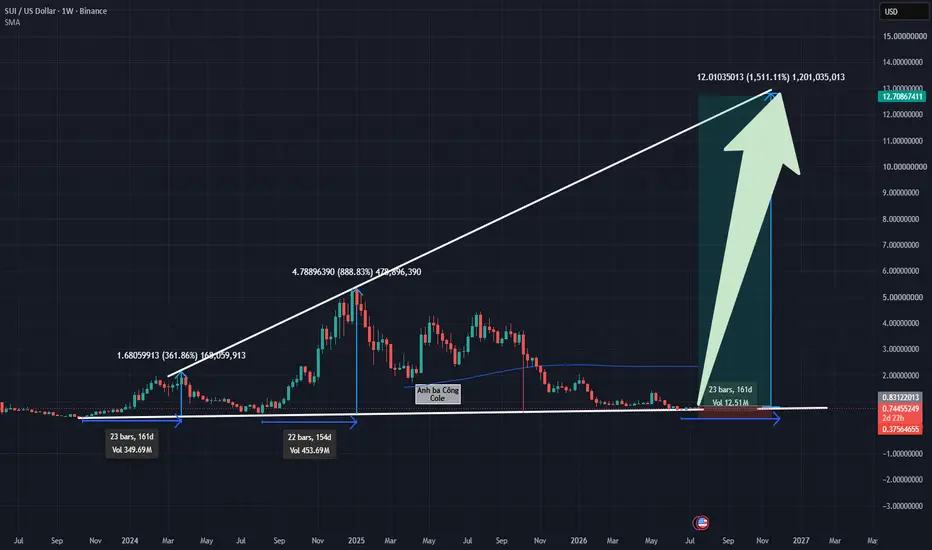
Based on the visual data from the weekly chart, SUI's cyclicality is repeating with remarkable precision. During the previous two tight compression phases, the market logged explosive, vertical rallies lasting approximately 22 to 23 weeks. This recurring behavior has systematically established a large-scale macro ascending expansion triangle.
Currently, the price action is undergoing its third compression phase directly at the structural support floor. Should historical patterns repeat accurately, this range-bound compression will serve as the launchpad for a powerful bullish wave. The projected target for this cycle aims to propel SUI toward a new all-time high exceeding the $12 milestone by the end of the year. This represents an ideal window for patient investors to build long-term positions ahead of the breakout.
Disclaimer: This is not financial advice, DYOR.
SUI is entering a highly pivotal technical compression phase on the weekly timeframe, carving out a compelling macro trading opportunity. The current price action is moving sideways within an extremely tight volatility range. In market structure theory, this persistent consolidation indicates that selling pressure is completely exhausted, allowing institutional liquidity to quietly accumulate positions in preparation for the next expansion phase.
Based on the visual data from the weekly chart, SUI's cyclicality is repeating with remarkable precision. During the previous two tight compression phases, the market logged explosive, vertical rallies lasting approximately 22 to 23 weeks. This recurring behavior has systematically established a large-scale macro ascending expansion triangle.
Currently, the price action is undergoing its third compression phase directly at the structural support floor. Should historical patterns repeat accurately, this range-bound compression will serve as the launchpad for a powerful bullish wave. The projected target for this cycle aims to propel SUI toward a new all-time high exceeding the $12 milestone by the end of the year. This represents an ideal window for patient investors to build long-term positions ahead of the breakout.
Disclaimer: This is not financial advice, DYOR.

免責事項
これらの情報および投稿は、TradingViewが提供または承認する金融、投資、取引、またはその他の種類の助言もしくは推奨であることを意図したものではなく、またこれらに該当するものでもありません。詳細は利用規約をご覧ください。
免責事項
これらの情報および投稿は、TradingViewが提供または承認する金融、投資、取引、またはその他の種類の助言もしくは推奨であることを意図したものではなく、またこれらに該当するものでもありません。詳細は利用規約をご覧ください。