
SUI is trading near a major support area after recent selling pressure, while several technical signals are beginning to favor a potential bullish recovery.
Fundamentally, Sui continues to expand through Mercado Bitcoin in Brazil, its growing DeFi ecosystem, and tokenized assets, although upcoming token unlocks and increasing circulating supply remain short-term risks.
Can SUI defend this support and break $0.95 to trigger its next major rally?
Fundamental Outlook
Sui continues to show promising ecosystem development, but token unlocks and broader crypto market uncertainty could keep selling pressure elevated in the short term.
Technical Analysis
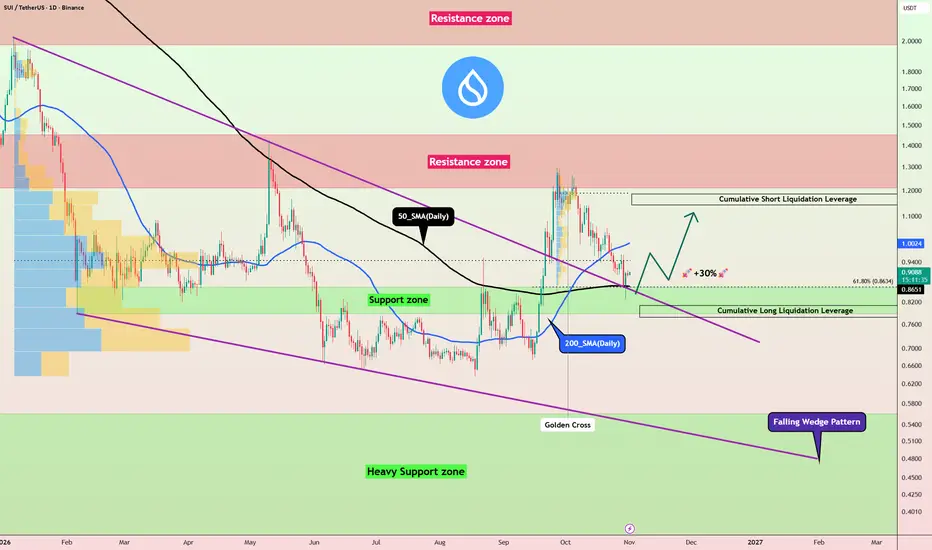
On the Daily time frame, SUI is trading near the Support Zone($0.788-$0.862) and the Cumulative Long Liquidation Leverage($0.778-$0.810).
From a classical technical analysis perspective, SUI appears to have completed its Pullback to the previously broken Falling Wedge Pattern, potentially setting the stage for a bullish recovery.
A recent Golden Cross also adds another bullish signal to the structure.
💡 Educational Note: A Golden Cross occurs when a shorter-term Moving Average crosses above a longer-term Moving Average and can indicate strengthening bullish momentum, although price confirmation remains important.
Bullish Scenario
The key level I am watching is $0.95.
If SUI successfully breaks and holds above $0.95, I expect bullish momentum to strengthen, potentially opening the way for an approximately 25% rally toward $1.19.
The Cumulative Short Liquidation Leverage($1.142-$1.186) could become an important upside target along the way.
However, holding the current Support Zone remains essential for this bullish scenario.
Trade Setup
Take Profit(TP): $1.125
Stop Loss(SL): $0.770(Worst)
Key Trading Level: $0.95
Cumulative Long Liquidation Leverage: $0.778-$0.810
Cumulative Short Liquidation Leverage: $1.142-$1.186
Which level do you think SUI will reach first?
🟢 $1.125
🔴 $0.770
📌 SUI Analysis(SUIUSDT), Daily time frame.
🛑 Always use proper risk management and set a Stop Loss(SL) for every position.
🚀 If this analysis helps your trading plan, a BOOST would help more traders discover it.
Fundamentally, Sui continues to expand through Mercado Bitcoin in Brazil, its growing DeFi ecosystem, and tokenized assets, although upcoming token unlocks and increasing circulating supply remain short-term risks.
Can SUI defend this support and break $0.95 to trigger its next major rally?
Fundamental Outlook
Sui continues to show promising ecosystem development, but token unlocks and broader crypto market uncertainty could keep selling pressure elevated in the short term.
Technical Analysis
On the Daily time frame, SUI is trading near the Support Zone($0.788-$0.862) and the Cumulative Long Liquidation Leverage($0.778-$0.810).
From a classical technical analysis perspective, SUI appears to have completed its Pullback to the previously broken Falling Wedge Pattern, potentially setting the stage for a bullish recovery.
A recent Golden Cross also adds another bullish signal to the structure.
💡 Educational Note: A Golden Cross occurs when a shorter-term Moving Average crosses above a longer-term Moving Average and can indicate strengthening bullish momentum, although price confirmation remains important.
Bullish Scenario
The key level I am watching is $0.95.
If SUI successfully breaks and holds above $0.95, I expect bullish momentum to strengthen, potentially opening the way for an approximately 25% rally toward $1.19.
The Cumulative Short Liquidation Leverage($1.142-$1.186) could become an important upside target along the way.
However, holding the current Support Zone remains essential for this bullish scenario.
Trade Setup
Take Profit(TP): $1.125
Stop Loss(SL): $0.770(Worst)
Key Trading Level: $0.95
Cumulative Long Liquidation Leverage: $0.778-$0.810
Cumulative Short Liquidation Leverage: $1.142-$1.186
Which level do you think SUI will reach first?
🟢 $1.125
🔴 $0.770
📌 SUI Analysis(SUIUSDT), Daily time frame.
🛑 Always use proper risk management and set a Stop Loss(SL) for every position.
🚀 If this analysis helps your trading plan, a BOOST would help more traders discover it.
トレード稼働中
Trade was activated
ProTrader365 | Crypto & Forex Analyst
8+ Years Experience • Elliott Wave • Volume & Order Flow
Free Signals, Market Analysis & Education
Explore our community & VIP services:
linktr.ee/ProTrader365
8+ Years Experience • Elliott Wave • Volume & Order Flow
Free Signals, Market Analysis & Education
Explore our community & VIP services:
linktr.ee/ProTrader365
免責事項
これらの情報および投稿は、TradingViewが提供または承認する金融、投資、取引、またはその他の種類の助言もしくは推奨であることを意図したものではなく、またこれらに該当するものでもありません。詳細は利用規約をご覧ください。
ProTrader365 | Crypto & Forex Analyst
8+ Years Experience • Elliott Wave • Volume & Order Flow
Free Signals, Market Analysis & Education
Explore our community & VIP services:
linktr.ee/ProTrader365
8+ Years Experience • Elliott Wave • Volume & Order Flow
Free Signals, Market Analysis & Education
Explore our community & VIP services:
linktr.ee/ProTrader365
免責事項
これらの情報および投稿は、TradingViewが提供または承認する金融、投資、取引、またはその他の種類の助言もしくは推奨であることを意図したものではなく、またこれらに該当するものでもありません。詳細は利用規約をご覧ください。