ロング
Another way to look at SUKU
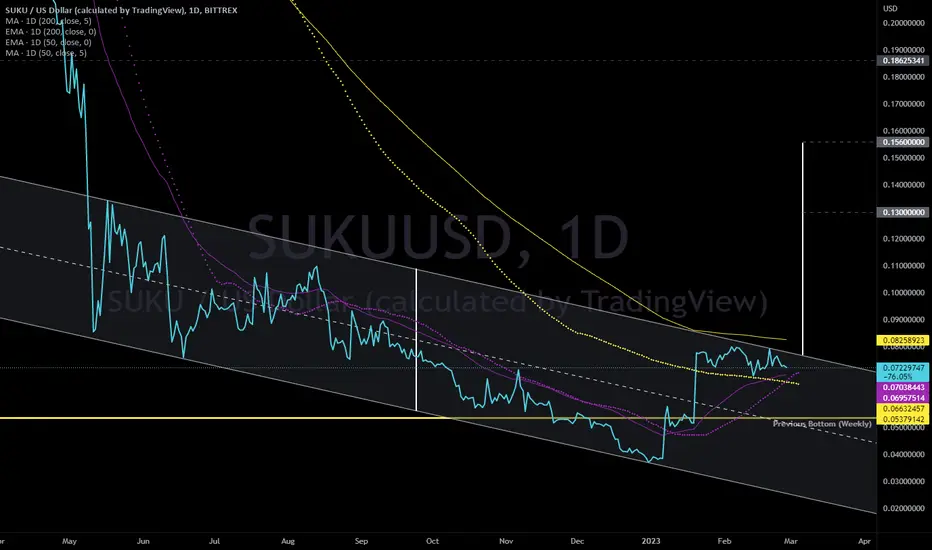
Previously posted a falling wedge pattern. After breaking out of that wedge, it has formed a parallel channel (non-log chart).
I think there's a good chance we get a channel breakout as well, which would move previous falling wedge targets up a bit.
Why a good chance? SUKU has a golden cross on the 50/200 day MA (dotted lines), and is currently sitting between the 50/200 day EMA (solid). It has so far failed to drop below both the 200 day MA and the 50 EMA since moving above it. Continue to do so and we'll get our channel breakout soon.
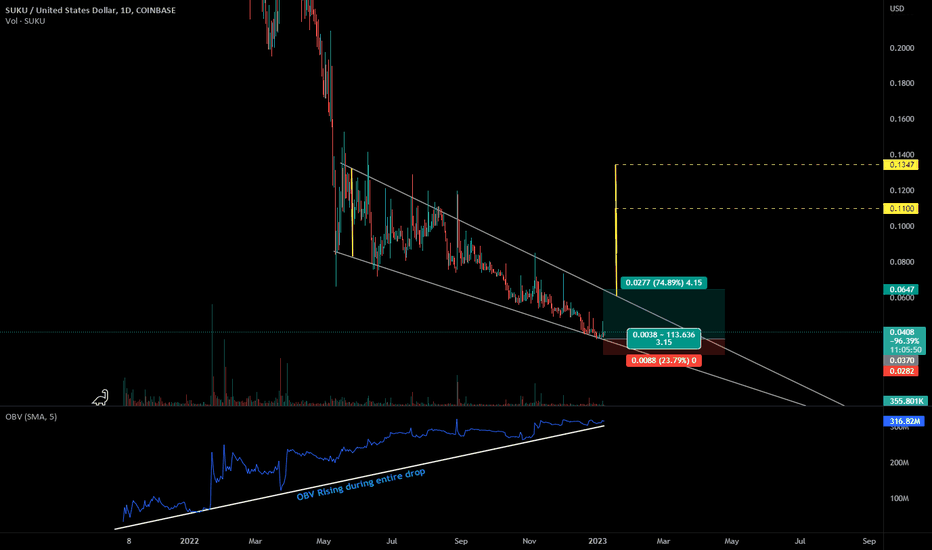
Falling wedge's previous TP 2 was around 13.3 cents. Channel's TP 1 is around 13 cents, so that target still remains relevant. However, now we have a TP 2 from the channel break around 15.6 cents.
Previous falling wedge idea shown below, which remains in play as well:
I think there's a good chance we get a channel breakout as well, which would move previous falling wedge targets up a bit.
Why a good chance? SUKU has a golden cross on the 50/200 day MA (dotted lines), and is currently sitting between the 50/200 day EMA (solid). It has so far failed to drop below both the 200 day MA and the 50 EMA since moving above it. Continue to do so and we'll get our channel breakout soon.
Falling wedge's previous TP 2 was around 13.3 cents. Channel's TP 1 is around 13 cents, so that target still remains relevant. However, now we have a TP 2 from the channel break around 15.6 cents.
Previous falling wedge idea shown below, which remains in play as well:

関連の投稿
免責事項
これらの情報および投稿は、TradingViewが提供または承認する金融、投資、取引、またはその他の種類の助言もしくは推奨であることを意図したものではなく、またこれらに該当するものでもありません。詳細は利用規約をご覧ください。
免責事項
これらの情報および投稿は、TradingViewが提供または承認する金融、投資、取引、またはその他の種類の助言もしくは推奨であることを意図したものではなく、またこれらに該当するものでもありません。詳細は利用規約をご覧ください。